

Strategic Assessment
In this article we analyze population dynamics in Israel, while focusing on changes in population age structure since the 1950s. We emphasize the decisive role of fertility patterns in long-term demographic processes, while identifying the important impact of large waves of international migration that substantially enlarged the small original population of Israel. The analysis focuses on the central variable that impacts GDP per capita—the proportion of the population of working age. We show that this proportion rose significantly in the 1990s, and may have played a decisive role in raising the standard of living in Israel. Based on population forecasts published by the Central Bureau of Statistics (CBS), we analyze potential changes in the population structure, focusing in particular on the percentage of working age people in the population. We show that fertility levels during the coming decades will have a definitive impact on the rate of population growth and the proportion of working age people. We demonstrate how a future reduction in the current high fertility rate, which is unique to Israel amongst developed societies, may bring with it the potentially positive effect of a “demographic dividend,” which may significantly improve Israel’s chances of successfully managing expected challenges to its economic growth—challenges that result from (geo)political conditions and climate change, as well as growing population density, an aging population and changes in the composition of the working age population.
Key words: Israeli demography, demographic dividend, age structure, population dynamic
Introduction – Age Structure and Economic Growth
Population characteristics, such as age structure, are determined by changes over time in patterns of fertility, mortality and migration. The population age structure has important implications for many social and economic processes, including economic growth. In this research we examine how historic changes in fertility, mortality and migration in Israel have determined the age structure of the population, and how they may continue to influence it in the future.
The potential and actual influence of demographic processes on economic growth and welfare have been discussed extensively, in particular the connection between age structure and economic growth (Bloom et al. 2003, 1-23; Coale and Hoover 1958, 18-25; Mason 2007, 81-101; Misra 2017, 99-107). Studies show that the age structure of the population changes dramatically in the wake of changes in fertility and migration, and to a lesser extent mortality (Friedlander 1975, 581-599), and that changes in age structure and especially in the proportion of the population of working age[1] can substantially influence economic growth. It has also been claimed that appropriate policy measures can enhance the positive impact of the growth of the proportion of the population of working age and significantly extend the duration of its impact (Mason 2007, 97).
The link between demography and economic growth has been extensively analyzed. Many studies focused on the primary questions raised by Thomas Malthus in 1798 regarding the connection between the rate of population growth and economic well-being. In a seminal work from 1958, Ansley Coale and Edgar Hoover analyzed how demographic factors can influence per capita income. They examined three variables: population size, rate of population growth and age distribution. Their work demonstrated that in developing countries there are many short- and medium-term benefits to a reduction in fertility, and as a result a reduction in population growth (Coale and Hoover 1958).
A trenchant debate on this subject coalesced around two primary approaches: the pessimists claimed that continued population growth would lead to an economic disaster in terms of income per capita, while the optimists claimed that population growth would lead to economic growth. Over the years a third, neutral approach became more widespread; it claims that population growth is not inherently connected to economic growth (Bloom et al. 2003, 1-23). In recent decades the role of age structure in economic growth has been emphasized more and more, while focusing on what is known as the “demographic dividend” (DD), which yields an opportunity for economic growth in the wake of reducing fertility from high to low.
The logic behind the DD can be illustrated in a basic manner via the formula (Bloom and Canning 2004, 13):
Y/N = Y/L * L/WA * WA/N
Where Y=income, N=population size, WA=working age population, and L=labor force participants.
We can denote this as: y = z * p * w
In other words: Income per capita (y = Y / N) equals production per worker (z = Y / L) times the proportion of people of working age (w = WA / N) times the proportion of labor force participation (p = L / WA).
If the rate of working age people w in a given population increases to w' = w + δ (where δ > 0) with no change in p and in z, the gross domestic product per capita will increase by a factor of w'/w. Thus if w=50%, an increase of 1% means a ratio of w'/w of 1.020 (=50/51), meaning that income per capita will increase by 2%. If w=40 than an increase of 1% is translated to an increase of 2.5% (1.02=40/41) in income per capita. Given that in most populations the proportion of working age people ranges from 40%-60%, an increase of 1% in w will translate to a change of between 1.7-2.5% in income per capita. (The same logic in reverse applies if δ < 0.)
The processes discussed here are of course more complex. The rate of labor force participation and production per worker depend on exogenous and endogenous factors, some of which are linked to one another and to the proportion of working age people. This basic illustration was merely intended to show the potential effect of an increase of one percentage point in the proportion of the population of working age on GDP per capita. And in fact, based on detailed empirical models and data from many countries it has been estimated that an increase of one percentage point in the proportion of people of working age does indeed lead to an increase of 1.6% in per capita production (Cruz and Ahmed 2018, 100). Other studies found that the annual growth of production per capita that can be attributed to the demographic dividend in the years 1970-2000 ranged from near-zero in sub-Saharan Africa (0.08%) to 1.7%-1.9% in Latin America and South and East Asia accordingly (Mason 2007, 94). It should be noted that the demographic dividend effect is temporary, and afterwards a reversal is expected (a reduction in the proportion of the population of working ages), but the dividend’s effect may continue for decades and allow for savings in order to better manage the eventual reversal. The dividend is considered an opportunity for countries with relatively high fertility to raise their income per capita by reducing their fertility. In order to take advantage of this opportunity, appropriate conditions and policies are necessary. For example, in Latin America the annual increase attributed to the demographic dividend of 1.7% led to a rate of growth of only 0.9% in GDP per capita, because other factors pushed towards decrease in GDP per capita; though without the effect of the dividend, the annual per capita growth rate in Latin America would have been negative (-0.8%). On the other hand, in South and East Asia the dividend contributed some 44% of an annual per capita growth rate of 4.2%. It should be emphasized that economic conditions and policy (Mason 2007, 97) and levels of education (Lutz et al. 2019, 12802) determine the extent to which advantage is taken of the opportunity offered by the demographic dividend.
Below we analyze the particular dynamics of change in the age structure of Israel’s population since the founding of the state, and three possible scenarios of expected future changes. Emphasis is placed on the relative size of the working age population, and changes that according to the current literature cited above will have fundamental implications for Israel’s per capita income and economic growth. The Israeli population is comprised of groups with distinct demographic patterns (especially regarding fertility and migration) and economic patterns (especially employment rates and productivity). However, the present analysis focuses on the collective effect of these groups at the population-wide level as one complete unit.
Israel – Rapid Growth Due to High Natural Increase and Large Waves of Immigration[2]
Israeli demography is characterized by rapid population growth—a combined result of significant natural increase and a large positive migration balance. Since the establishment of the state in May 1948 the population has increased 12-fold, from 806,000 to 9.6 million in 2022, with an average annual growth rate of 3.4% over the course of 74 years.
The population growth rate was not uniform over these years. In the first decade it averaged some 8% per year and reflected the impact of a massive immigration wave, which began in 1948 and led to a doubling of the population within less than four years, alongside high natural growth (2.5% per year). During the second decade population growth slowed and remained just over 3%, and during the third decade it slowly converged on a growth rate of slightly below 2% per year with some variability, mainly due to additional waves of immigration.
Two large waves of immigration took place during the years 1948-1952 (some 750,000 immigrants) and 1990-2000 (around one million immigrants). Smaller waves occurred between 1955-1957 (167,000), 1961-1964 (229,000) and 1969-1974 (259,000). However, the waves that came after the large 1948-1952 wave had less impact on demographic developments, because the absorbing population was significantly larger. In particular, the demographic impact of the largest wave of immigration, which took place in the 1990s, was significantly lower in comparison to that of the first wave. Overall, from the establishment of the state of Israel until the end of 2020, the migration balance was 2.8 million people, or one-third of the population growth during that time. However, during that same time period, natural increase (including that of immigrants) was the primary component of growth (67%). It ranged from 2.7% per year in the 1950s to 1.6% annually over the past decade.
High natural growth was the result of a high fertility rate that went from over four births per woman on average in the 1950s to the (high) rate of 2.9 births per woman in the 1990s, and went up again after 15 stable years to 3.1 births per woman in the years 2015-2019. Such a high fertility rate led to a crude birth rate of 30 children for every 1,000 people in the population in the 1950s, which decreased to 20 per 1,000 people in recent years. The contribution of the crude mortality rate to population growth was minimal: a small decrease from six deaths per 1,000 people in the 1950s to five per 1,000 people in recent years reflected an increase of life expectancy from around 60 years to over 80 years (82 years for men, 86 for women).
The Special Dynamic of Changes in Age Structure
The age structure of the population at a given time, or in other words, the share of the different age groups in the overall population, is determined by changes in the three demographic movements over the preceding decades: fertility, mortality and migration. In other words, the age structure is not only influenced by these changes over recent years but also by the age structure that was created as a consequence of changes in these movements in the distant past. In this way a process is created, by which the age structure at a given point in time is influenced by the age structure at a more distant point in the past. For example, in a population without migration and with low mortality levels, the number of children aged 0-4 at a given time is a function of fertility rates over the preceding five years (during which those children were born), and of the proportion of people at the childbearing ages in the overall population during those five years. This proportion in turn is determined by the fertility rate and the portion of the population of childbearing age in the distant past, and so on. At the other end of the age structure, the number of people aged 85 and above in the population at a given time, is influenced by the accumulated mortality rate of the previous 85 years, but also by the original size of their birth cohort (born over 85 years ago). It is understood that with the addition of the migration component the process becomes somewhat more complex, but the principle remains the same.
When discussing a population transitioning from a high to low fertility rate, “population growth momentum,” a concept first coined and defined by Nathan Keyfitz, is created (Keyfitz 1971, 71-80); it can also be understood as “the inertia of the age distribution” (Potter et al. 1977, 555). This momentum guarantees that rapid population growth during a certain period will continue for many years, until the influence of the cohort size of women born during the time of high fertility disappears—which may take several generations, or in other words, many decades. The Israeli population provides an extraordinary and interesting example of this process.
The unique dynamic of the age structure of Israel’s population primarily reflects the influence of the large migration waves and particularly the mass immigration of 1948-1952, the initially high fertility rate, and its prolonged decline until the 1990s. The impact of the reduction in mortality is more modest; it is expressed primarily in a slow but ongoing growth in the rate of the elderly population. As a rule, age pyramids can be considered as demographic “story tellers”, wherein time moves from the top (the older groups—the past) down (to the most recent births—the present). Israel is a good example of this.
Upon first glance, it appears that the age structure of the pyramid of Israel in 2020 (Figure 1) is typical for a population with high fertility: a wide base and a triangular structure. Upon closer examination, however, details are revealed which tell a unique story. We will look at the top of the pyramid in 2020, at those aged 65 and above who are (the survivors of) those born before 1955. The shape of this group is not the triangle expected with a wider right side (reflecting better survival among women). This triangle exists only for those aged 75 and older, but below it the 65-74 year old age group is unusually wide: these are (the survivors of) those born between 1945 and 1954, around the time of the establishment of the State and during the wave of immigration that followed. This unusually wide group is a result of the sudden increase in births after 1945, arising from the combined influence of the wave of 750,000 immigrants during the years 1948-1952 and their higher rates of fertility, and to a lesser extent from the “baby boom” after World War II (Friedlander 1975, 597). The cohorts born immediately afterwards, after 1954, increased in size more modestly for some 15 years, and this is evident from the moderate growth (narrow “steps”) in the 60-64, 55-59 and 50-54 age groups in the 2020 pyramid. This moderate growth resulted from the decline in fertility rates that began almost immediately after the massive immigration wave (and continued declining until the early 1990s). As a result of these changes, the age groups from 50-74 (rectangle I) form a unique parallelogram shape.
When looking at the age groups of the following 25 years (ages 25-49), the age groups 45-49 and 40-44 seem much wider than those above them—the age groups 55-59 and 50-54—which reflects the population momentum effect:[3] those aged 40-49 are primarily (the survivors amongst) the children of the large groups born around the time of the establishment of the state, and therefore the groups are wider. Further on, because the groups born after 1954 grew less, the younger age groups (their children) aged 25-39 in 2020 show more modest growth (as was seen with the 50-64 age group in parallelogram I). This creates a second parallelogram.
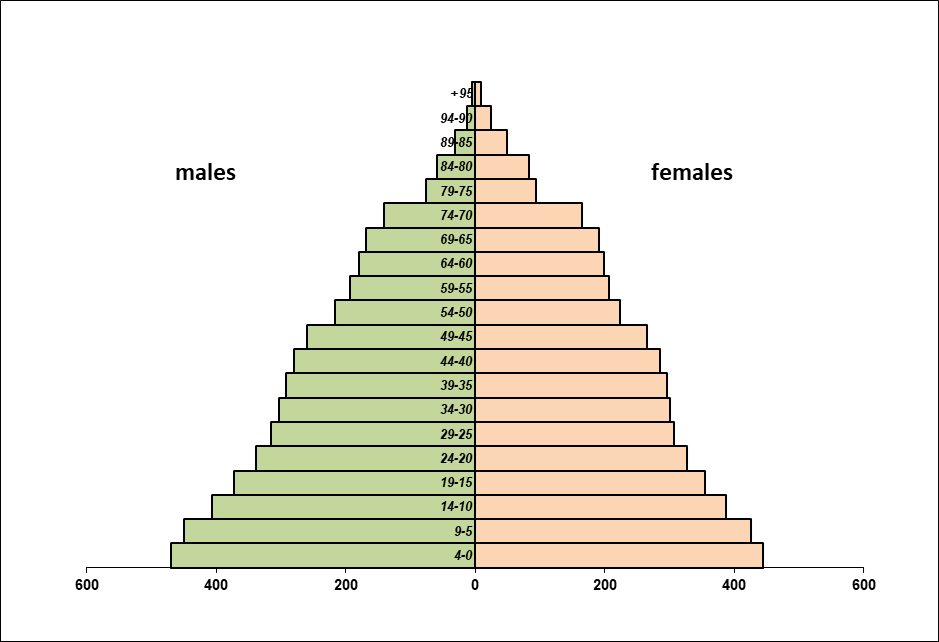
Figure 1: Israeli Population Age Pyramid, 2020 (Population Size in Thousands) | Source: CBS yearbook, 2021
In the 2020 pyramid the process described above takes on the final shape of three parallelogram-like shapes of 25 years each, which expand as one descends along the pyramid: the first and highest shape (parallelogram I) includes 50-75 year olds and after it is a new, wider but similar shape (parallelogram II), made up of 25-49 year olds. It seems as if the first shape was reproduced, but wider. Afterwards (below parallelogram II), a third shape (parallelogram III, ages 0-24) appears to be a wider reproduction of the previous two shapes, although its pace of development is different, and its base is wider.[4]
The age pyramids of the years 1955, 1980 and 2005 (Figure 2) allow one to follow the process of creation of the parallelograms and the flow of the cohorts that comprise them, during the years across the various age groups. The base of the 1955 pyramid shows the beginning of the creation of the first parallelogram; in the 1980 pyramid the population from the first parallelogram has already reached ages 10-34, which means that most of it has reached the age of parenthood and their children appear at the bottom of the pyramid, heralding the creation of the second parallelogram; in the 2005 pyramid the first parallelogram has left the age of becoming parents and populates the ages of older workers (ages 35-59), and it is the turn of the second parallelogram to populate the age of parenting, whose children herald the creation of the third parallelogram at the bottom of the pyramid. The three shapes are also connected to the new immigrants who arrived during the early years of the state: the first parallelogram consists primarily of the children of these immigrants, the second of their grandchildren and the third is primarily their great-grandchildren.
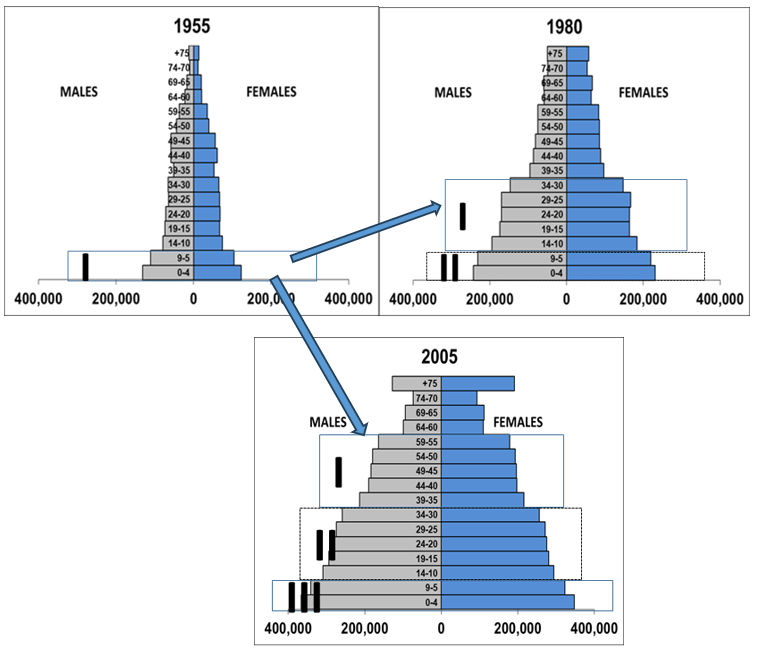
Figure 2: Age Pyramids of Israel: 1955, 1980 and 2005 (Population Size in Absolute Numbers—thousands) | Source: CBS yearbooks, 1956, 1981 and 2006
Dov Friedlander (Friedlander 1975) analyzed this unique process until the early 1970s and named it the “echo effect” of the massive migration wave of 1948-1952. It is interesting to discover how this echo, which we know today as population momentum, continued to play a decisive role in Israeli population dynamics for over 65 years (and is expected to continue doing so in the future), while the population grew from 1.5 million in 1955 to over 9 million in 2020—many of whom (over 2.5 million) are immigrants who arrived after 1955.
The differential growth of such close cohorts presents complex challenges. For example, when the large cohorts of those born between 1945-1954 began entering elementary school, there was a need for a great number of schools and teachers, in comparison to previous years. Later on, in the late 1960s, these large groups reached the age of higher education, leading to demand for new universities (which was also enhanced by an increase in general levels of demand for higher education). These large groups also needed housing and workplaces at the same time, meaning that they created pressure to rapidly and significantly increase the supply of apartments and workplaces. Even the marriage market was heavily influenced, when large groups of women of marriageable age, who had traditionally married men older than themselves, found that the older age groups of potential husbands were relatively small (Ben Moshe 1985, 87-95). When there is a crisis in the housing market and the job market, the weaker parts of society suffer more: it is not a coincidence that the Black Panthers protesters took to the streets in 1968, when the competition in the housing and job markets had become more difficult.
From the analysis of population dynamics in this section we learned about the process of cohort flow over the years, and in the specific case of Israel—how the flow of a unique structure caused a sharp expansion of certain age groups every 25 years (the approximate length of a generation), and how this may have influenced certain systems and especially, the proportion of the population of working age, which is the focus of our analysis.
Changes in the Proportion of the Working Age Population
In this section we will examine how the demographic movements with their special dynamics reviewed in the previous chapter, are reflected in changes in the proportion of the working-age population. To do so we will focus on three age groups: people of working age 20-64,[5] children aged 0-19, and elderly people aged 65 and up. We know that changes in the proportion of the working age population are inversely connected to changes in the sum of the proportions of the younger and older age groups. In Figure 3 below the development of the age structure amongst these three groups is presented for the years 1950-2020.
Four key periods that can be identified in the figure, show clear trends of change in the proportion of children and the proportion of people of working age, which changed as expected in opposite directions, while the proportion of the population at the older ages shows an ongoing trend of apparently gradual increase across all periods.
During the first period between 1950 and 1963 there was a sharp increase in the proportion of children (+4.7%) alongside a decrease in that of working age people. The proportion of the elderly in the population also increased (modestly: +1.5%), which exacerbated the decline in the proportion of working age people that went down -6.2% in total (from 55.6% to 49.4%).
As we saw, during these years the form of the age structure at the base of the pyramid took shape (parallelogram I in the previous section). New immigrants who arrived in high numbers during the early years of this period made up some half of the population during this time, and the age structure that was created was influenced primarily by their high fertility rate and by their concentrated arrival during a short time span (Friedlander 1975, 592-595), as well as by the decline in infant and child mortality and the decline in the fertility rate afterwards. It is more challenging to explain the small increase in elderly people, because throughout this period most of these were immigrants who arrived from many countries, most of them from Europe.[6] It seems that this increase was caused by the entry of larger cohorts into old age than those that had come before, together with the ongoing decline in the rate of mortality (which continues until today, see Figure 4 below.)
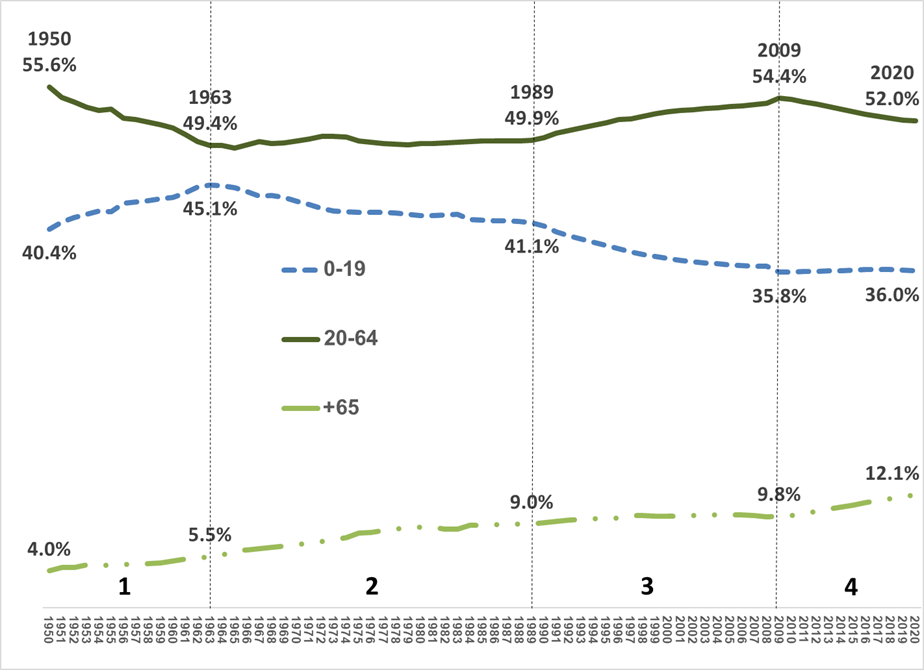
Figure 3: Age Structure of the Israeli Population, 1950-2020[7] | Data source: CBS, statistical yearbooks
Figure 4 – Mortality: Life Expectancy at Age 0 and at Age 65 by Sex—Until 1965-1969 for Jews Only, From 1970-1974 for the Entire Israeli Population | Data source: CBS, statistical yearbooks
During the second period from 1964-1989 the trend of increase in the proportion of children reversed, and underwent a prolonged decline of -4.0%. Nevertheless, because of a parallel increase in the proportion of the population of elderly (+3.5%), the proportion of people of working age increased only moderately (+0.5%).
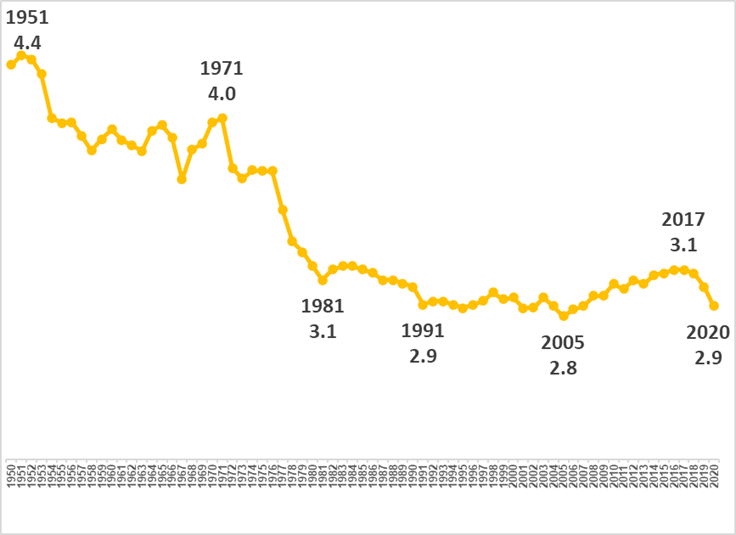
Figure 5: Overall Fertility Rate for the Israeli Population, 1950-2020[8] | Data source: CBS, statistical yearbooks
The decline in the proportion of children aged 0-19 is related to the continuing fall in fertility rates, which began in the early 1950s after a peak of 4.4 births per woman (see Figure 5 above). For the first 20 years this decline picked up speed and within a decade total fertility fell to 3.1 births per woman and continued to decrease slowly to the level of 2.9 births per woman during the early 2000s. At the same time, the large cohorts born during the years 1945-1969 (parallelogram I) reached childbearing age, which led to an increase in the number of births during that period (and following that to an increase in the number of children aged 0-19) and reduced the effect of the decline in fertility rates. An important additional factor that contributed to the decline in the proportion of children and to an increase in the proportion of people of working age was immigration: during this period some 675,000 immigrants entered Israel (see Table 1 below). Those who entered came primarily (75%) from Europe and America with relatively few children (33% of the immigrants were children, as compared to 45.1% for the entire population at the beginning of this period) and a high proportion of people of working age (57.1% compared to 49.1% of the population). Also during this period, it is challenging to explain the causes of the increase in the proportion of the elderly population, which mainly included immigrants from Europe from various periods,[9] beyond the continued moderate growth of the cohorts entering old age and the continued decline in mortality rates.
During the third period from 1990-2009 there was a sharp decrease in the proportion of children aged 0-19 (-5.3%), alongside a parallel increase in the proportion of the working age population (+4.5%) and a mild increase in the proportion of the elderly (+0.8%).
Two main factors contributed to these changes. The first factor—the reduction of the proportion of children—was, as in the previous period, the accumulated effect of the earlier reduction in the fertility rate: those aged 0-19 at the beginning of the period (1990) were born during the years 1971-1990, during which as we saw the fertility rate dropped sharply from 4.0 to 3.0 births per woman, and those who were 0-19 years old at the end of the period were born during the years in which the fertility rate was a full child lower than it had been at the beginning of the period. The second factor was, once again and even more so, immigration[10] (see Table 1 below). During this period over 1.2 million immigrants, primarily from the former Soviet Union, arrived in Israel. Their fertility rate was especially low (below replacement level fertility), the proportion of children they brought with them was substantially lower (30.2% on average across the entire period) and the rate of working age people (58.2%) was high in relation to that of the population that absorbed them (41.1% and 49.9%, respectively, in 1989). The immigrants also had a higher proportion of elderly people (11.6% versus 9.0% in the receiving population); nevertheless, and in spite of the ongoing decline in mortality rates across all years, the proportion of elderly people changed very little during this period because the cohorts entering old age were relatively small.[11]
Table 1: Immigrants (in Thousands) and their Age Structure Compared to the Israeli Population at the Beginning of Each Period, 1948-2020
| Period | Immigrant population (thousands) | Age structure of the immigrant population during the period | Age structure of the Israeli population at the beginning of the period | ||||
| Total | 0-19 | 20-64 | 65+ | 0-19 | 20-64 | 65+ | |
| 1963-1948 | 1,155 | 40.7% | 55.0% | 4.3% | 40.4% | 55.2% | 4.4% |
| 1989-1964 | 674 | 33.4% | 57.1% | 9.5% | 45.1% | 49.4% | 5.5% |
| 2009-1990 | 1,225 | 30.2% | 58.2% | 11.6% | 41.1% | 49.9% | 9.0% |
| 2020-2010 | 253 | 24.7% | 61.8% | 13.5% | 35.8% | 54.4% | 9.8% |
Data source: CBS, statistical yearbooks
During this period the population of childbearing age transitioned from those who were the children of the mass immigration (parallelogram I) to the larger generation of their children (parallelogram II). However, due to the continued reduction in fertility rates this change did not have a significant effect on the proportion of children aged 0-19 (and therefore not on the relative proportion of working age people).
During the fourth and final period 2009-2020, the proportion of children aged 0-19 was stable, but the proportion of people of working age declined by 2.4% along with a sharp increase in the proportion of elderly, from 9.8% to 12.1%.
The relative stability in the proportion of children aged 0-19 during this period was the result of counterbalancing effects of, on the one hand, a small increase in the fertility rate in previous years (2005-2017) and also of a very small increase in the proportion of the population at the primary childbearing ages, and, on the other hand, the arrival of immigrants (250,000) with low numbers of children and low rates of fertility. These combined effects resulted in little net effect on the proportion of children aged 0-19, and therefore on the proportion of people of working age.
The decline in mortality contributed, as in previous years, to an increase in the proportion of the elderly in the population, but the aging of the large cohorts born between 1945-1954 (parallelogram I) was what really caused the jump in the number of elderly, and with it the decline in the proportion of the population of working age.
During this period the fertility rate, which had remained stable at around 2.9 births per woman between 1990 and 2010, began to increase from 2011 onwards. It reached 3.1 births per woman in 2017 and then declined again to 2.9 in 2020, but the effect of this increase in fertility is likely to be felt in the coming years.
Conclusion
Since the establishment of the state the proportion of the working age population has undergone many changes. The first period saw sharp decline, the second period exhibited long stagnation (25 years) at a relatively low level, the third period saw an impressive 20-year increase, and then in the last decade there was a rapid decrease.
It also clear (according to Table 1) that all the waves of migration except the post-1948 mass migration, reflect an age structure with higher proportions of working age people than in the host population. This is similar to most migrations around the world. In other words, from this point of view over time immigrants have a positive impact on the society that receives them.
Three main factors have played a central role in this process: The fertility rate, the age structure of immigrants (which is primarily a result of their fertility prior to their arrival in Israel), and the decline in mortality. The high fertility rate during the first period caused a decline in the proportion of working age people. During the second period fertility began to decline but the impact of the high fertility rate of the past, along with the increase in the population of elderly, reduced the effect of this decline and caused long-term stagnation. The decline in fertility was fully expressed during the third period, but together with the age structure of the many immigrants, the overall result was a sharp increase in the proportion of working age people. In the last period stagnation in the fertility rate (and even a certain increase) together with an increase in the proportion of elderly (also a result of the high fertility during the 1950s) caused a concerning decrease in the proportion of working age people.
We also saw that fertility patterns played a central role in determining the age structure in the past, and we assess that this will be the case in the future as well. In the next section we will examine how different scenarios, which are primarily focused on alternative fertility patterns, are likely to influence the future age structure of the Israeli population.
Future scenarios
Description of population forecasts
After analyzing historic changes in population structure, we will focus on assessing potential future developments. In order to do so we will make use of population forecasts prepared by the CBS that describe three different potential scenarios.
The CBS prepared scenarios according to age and sex for 50 years (2015-2065) according to three scenarios. The scenarios differed in the assumptions regarding mortality and fertility for three subgroups of the population (non-ultraorthodox Jews, ultraorthodox Jews and Arabs) which together comprise the total population in Israel.[12] The highest forecast used the lowest mortality rate and the highest fertility rate for the three population groups, and the lowest forecast used the highest mortality rate and the lowest fertility rate. The medium forecast, as its name indicates, used intermediate assumptions regarding mortality and fertility. Assumptions regarding migration are identical in the three scenarios.
Figure 6 below presents the assumed fertility for the total population[13] for these three scenarios: An increase from 3.3 births per woman to 4.5 in the high forecast, a decrease from 3.0 to almost 2.0 in the low forecast and relatively stability at around 3.2 births per woman in the medium forecast.
As a result of large differences in fertility between the three population groups, the rate of population growth differs substantially for these groups, which causes changes in population composition. This is expressed most notably in the prolonged increase in the proportion of ultraorthodox Jews, the group with the highest fertility, at the expense of the other groups. In other words, there is a composition effect which pushes the fertility for the whole population upwards even without a change in the fertility levels of each subgroup.
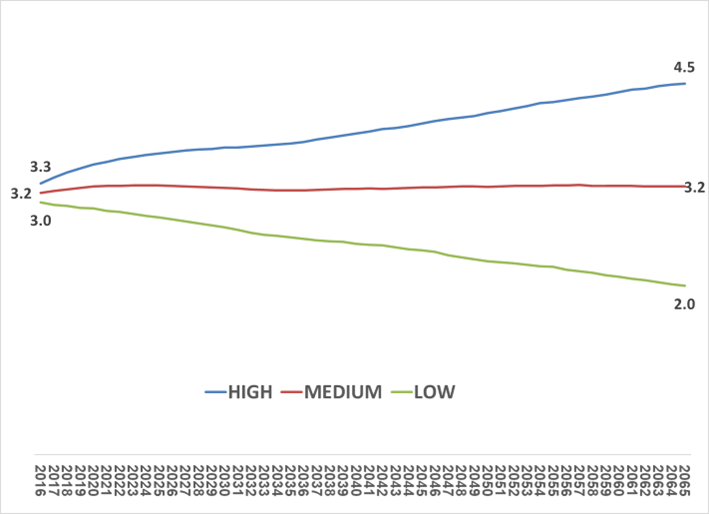
Figure 6: Total Fertility Rate for the Whole Population in Three Scenarios, 2015-2065 | Data source: CBS, data processed under specific request (based on the forecast assumptions for each group)
As a result, in the medium scenario, fertility remains stable at 3.2 throughout the forecast period at the population-wide level—a result of the assumption that for all groups fertility will decline significantly: for ultraorthodox Jews from 6.7 to 5.2, for non-ultraorthodox Jews from 2.5 to 2.3, and for Arabs from 3.1 to 2.3. In the low forecast, the decline in fertility in all groups is much steeper than in the overall population: for ultraorthodox Jews from 6.4 to 3.0, for non-ultraorthodox Jews from 2.4 to 1.7, and for Arabs from 3.0 to 1.6. In the high forecast, fertility increases from 3.3 to 4.5 for the total population, due to much smaller increases within the groups: in the ultraorthodox group from 7.0 to 7.4, in the non-ultraorthodox Jewish group from 2.6 to 2.9 and in the Arab group from 3.2 to 3.0 (a slight decline).
Changes in Age Structure
If no large unexpected migration occurs, the primary factors that will influence the population structure in the coming decades will be trends in future mortality and fertility. This is in light of the expected waning of the echo effect of the large birth cohorts born during the years of mass immigration. At the same time, declining mortality is expected to continue the perpetual increase in the proportion of the population who are elderly. In this context the main unknown variable is the pace of decline in mortality in the future, and to what extent the incidence of new mortality events such as the Covid pandemic is likely to influence the overall trend of over 100 years of continued decline in mortality. The mortality forecasts on which CBS population forecasts are based use various mortality rates, which translate to a 22% difference (or 0.6 million people) in the size of the population aged 65 and above in 2065. Although this difference is nontrivial, it is very small in comparison to the potential effects of predicted fertility trends. Fertility is thus expected to be the primary factor driving population changes in the future: in the low fertility scenario, the number of 0-19 year olds in 2065 (4.3 million) is expected to be 6.2 million people smaller than in the high fertility scenario (10.5 million).
As expected, the change in the proportion of children in the population varies significantly in the different scenarios (see Figure 7 below): In the high forecast their proportion is expected to grow from 36.1% to 42.3% by 2065 (comparable to their proportion at the beginning of the 1970s). According to the fertility assumptions of the medium scenario, the proportion of children in the year 2065 (35.6%) will remain at almost the same level it was in 2015 (36.1%), and according to the low forecast, the proportion of children in 2065 will be 8.5 points lower than it was in 2015, at 27.6%— lower than any level recorded for the State of Israel.
It should be emphasized that these variations in the proportion of children will take place while their absolute number changes dramatically. The number of children in 2016 was 3.1 million, while in 2065 it will be 10.5 million, 7.1 million or 4.3 million according to the three forecasts.
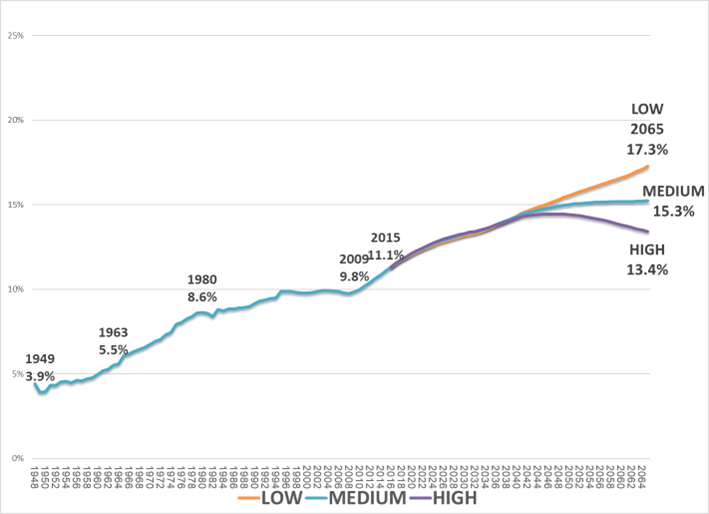
Figure 7: Proportion of Children Aged 0-19, 1948-2015, and in the Three Forecasts, 2015-2065 | Source: Authors’ Processing of CBS Population Forecasts – Israel Population Forecasts, 2015-2065.
The proportion of elderly people is expected to rise in the wake of the expected decline in mortality in all three forecasts (see Figure 8 below). However, the differences between the scenarios are significant beginning from the 2030s. Until then, in all three scenarios there is a sharp and nearly identical rise: from 11.1% in 2015 to 13.9% in 2037 (+2.8%) over a period of 22 years. From that point on, their proportion of the population will vary depending on the scenario: In the high forecast (high fertility, low mortality) their proportion will continue to grow slowly over time, reach its peak around 2045 (14.4%), and afterwards will decline, reaching 13.4% in 2065. In the low forecast (low fertility, low mortality) their proportion will continue to rise sharply, reaching 17.3% in 2065. In the medium forecast (stable fertility and moderate decline in mortality) their proportion will increase more modestly and will stabilize near its expected peak (15.3%) in the early 2050s.
The differences between the scenarios can be understood based on the different assumptions regarding mortality and fertility (which influence the proportion of children, and therefore the proportions of the other age groups), but why does the difference between them only develop 20 years into the forecast? The answer is that during this period, all three scenarios foresee a profound increase in the proportion of elderly as determined by population momentum. Indeed, during the years 2016-2030 the first parallelogram-like structure will fully enter the 65+ age group and will cause a jump in the rate of elderly people in all the scenarios. The next parallelogram (the next generation) also has relatively large cohorts, but they have much less influence. Therefore, only during the late 2030s and onwards will the differences in the proportions of people aged 65 and above in the three forecasts become dependent on the different assumptions about mortality and fertility.

Figure 8: Proportion of People Aged 65 and Above, 1948-2015, and According to the Three Forecasts, 2015-2065 | Source: Authors’ Processing of CBS Population Forecasts – Israel Population Forecasts, 2015-2065.
Changes in the Proportion of Working Age Population (20-64)
As a result of the differences between the forecasts in the proportion of children and the proportion of the elderly, the proportions of the population of working age exhibit different patterns in each scenario.
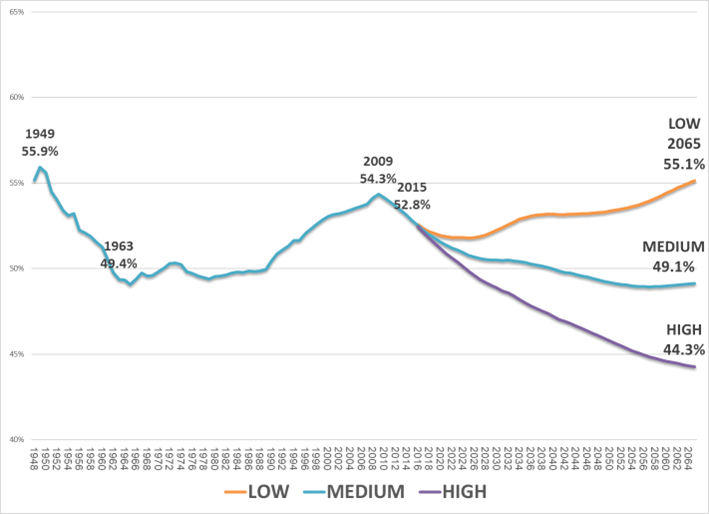
Figure 9: Proportion of People Aged 20-64, 1948-2015, and According to the Three Forecasts, 2015-2065 | Source: Authors’ Processing of CBS Population Forecasts – Israel Population Forecasts, 2015-2065.
In the high forecast (high fertility, low mortality) the proportion of elderly in the population is likely to grow less than in the low forecast (low fertility, high mortality), but the proportion of children is expected to grow much more sharply. The proportion of working age people is the complement of the sum of these two factors and therefore, in the high forecast it will be much lower than in the low forecast: In the high forecast the proportion of working age people is expected to decrease consistently from 52.8% in 2015 to 44.3% in 2065 (a decrease of 8.5%). This decrease primarily reflects the increase in the proportion of children (+6.2%) but also the parallel increase in the proportion of elderly (+2.3%). Such a proportion of working age people—44.3%—would be five points lower than the lowest proportion ever recorded in Israel.
At the other end, in the low scenario (low fertility, high mortality) the proportion of people of working age shows a complex pattern over the years: after a slight decrease of a percentage point between 2015 (52.8%) and 2022 (51.8%) and a period of stagnation of several years, from 2027 onwards the rate will increase by 1.3 percentage points until 2035 (53.2%). After that, it will enter a second and longer period of stagnation at this level until the year 2047, when a slow but continuous increase will begin that will reach a rate of 55.1% in 2065—2.3 percentage points higher than in 2015 and one of the highest ever recorded in Israel.
The proportion of people of working age according to the medium scenario (stable fertility and a moderate decrease in mortality rates) shows a downward trend, but less pronounced than in the high scenario. Starting with a relatively sharp decrease between 2015 (52.8%) and 2027 (50.5%) of 2.3 percentage points, the proportion will remain stable for several years, and from 2032 a slow but continuous decrease begins until it stabilizes around 49.0% starting from 2053—a level similar to the lowest recorded in Israel (49.4% in 1964).
Discussion – Future Demographic Challenges, Declining Fertility and the Demographic Dividend
Population forecasts show that different trends in fertility levels are likely to significantly affect the dynamic of the Israeli population, and especially the proportion of the population of working age. In the near future the influence of the state’s early mass migration, which had a profound influence on the demographic dynamics of the Israeli population until now, will fade. In the absence of a large, unexpected wave of immigration, the primary forces that will shape the future population dynamic in Israel will be patterns of fertility and mortality. Taking into consideration that historic trends in mortality indicate that life expectancy is likely to continue rising, the main question about mortality is the pace of decline. The future of fertility is much more uncertain.
The forecasts also indicate that it is not likely that Israel will enjoy another significant demographic dividend in the coming decades similar to the one that it experienced in the 1990s and early 2000s, unless there is a significant and rapid decline in fertility. This conclusion is also reflected in the long-term Israeli growth model developed by the Bank of Israel (Bank of Israel 2019; Argov and Tsur 2019), because “the basic forecast indicates that the future growth rate of GDP and GDP per capita are expected to be lower than historic averages, mainly due to future demographic developments and the exhaustion of significant growth drivers that operated in the past.” (Argov and Tsur 2019, 2).[14]
In spite of the above, the expected potential demographic dividend of a decline in fertility is far from negligible: in comparison to the situation in 2022 (51.8% of the population at working age), a decline in fertility according to the low forecast would lead to an increase of more than three percentage points in the proportion of population at working age in 2065. This would be translated into a potential per capita income growth of over 6%, in contrast with the high forecast, in which fertility continues to rise further, and which would lead to a decline of more than 7% in the proportion of population at working age in 2065. This would likely result in a decline of 15% in income per capita—an overall gap in per capita income of over 20% between the high and low forecasts.
High rates of population growth have already become a challenge for Israeli society. In recent years Israelis have dealt with longer traffic jams, manpower shortages in education and health care, and serious difficulties in renting or purchasing an apartment—these are the most widely noted challenges, and they all share a common cause: rapid population growth that requires the system to adapt and grow at least at the pace of population growth, in order to maintain the level of services that were provided in the past. Even in a relatively developed country such as Israel, it is difficult to cope with a prolonged high rate of population growth.
Today most countries in the world report a fertility rate of around 2.1 births per woman or below;[15] this is known as replacement rate (the fertility rate which over the long term ensures a population growth rate of zero). The present fertility and mortality rates in Israel imply a stable natural increase rate of over 1.5% per year (Coale and Demeny 1983). However, recently it looks like the fertility rate has stabilized and may be beginning to decline. Fertility, which reached 3.1 during 2016-2017, went down to 2.9 in 2020.[16] Such a decline is not supposed to indicate a change in trend but, as discussed above, we would have expected fertility to continue increasing and not to decrease in light of the expected changes in population composition.[17] Yet a sharp decrease would be necessary to cause a significant reduction in population growth rates and the production of a meaningful demographic dividend. Calculation of alternative scenarios of fertility decline (while using the same assumptions for mortality and migration used by the CBS) shows that the faster fertility declines to 2.0, the higher the potential demographic dividend is: If fertility immediately drops to 2.0, the proportion of working age people will peak at 57.1% by 2040 (in contrast with 52% in 2040 and 55.1% in 2065 in the low forecast). If fertility drops to 2.0 only by 2030, the peak will be at 55.5% in 2045. It should be emphasized that a drastic reduction in fertility is not expected to bring Israel closer to a negative natural population growth rate (as has occurred in other developed countries). Even if the fertility rate immediately drops to 2.0 births per woman, population growth is expected to remain above 0% until nearly the end of the twenty-first century.
The fertility rate may decline further in the future and perhaps this decline has already begun. It is also clear that a sharp decline in fertility would significantly benefit the Israeli population. Future demographic challenges will require the allocation of significant financial resources, such as the ongoing challenge of coping with rapid population growth (which even in the low forecast is expected to remain between 0.6% and 1.6% throughout the entire forecast period); the aging of the population; the absorption of ultraorthodox population of working age into the workforce;[18] the increase in population density—these are the most noteworthy. But not only demographic challenges lie ahead; there are also geopolitical risks and the consequences of climate change, which will consume substantial resources.[19]
Rapid population growth could also have other negative effects on Israeli society. Developed-world countries have experienced a long-term decline in fertility rates, to below replacement level, and are currently dealing with shortages in the working age population. As a result, many countries have decided to reduce formal and legal obstacles to immigration in order to attracts “skills and talent” (European Commission 2022, 1-22). In practice these countries plan to draw skilled and talented young immigrants from outside of the European community. If the situation in Israel does not improve rapidly, outward migration of skilled and talented working age people is likely to further exacerbate the situation.
The primary conclusion from this analysis is that if the current high fertility rate is maintained, it may endanger the Israeli economy in the near future; however, a significant reduction in the fertility rate will create an opportunity for a demographic dividend that will allow better management of expected economic, social and climate changes.
Sources
Ali, Elham, Wolfgang Cramer, Jofre Carnicer, Elena Georgopoulou, Nathalie Hilmi, Gonéri Le Cozannet and Piero Lionello. 2022. “Cross-Chapter Paper 4: Mediterranean Region.” In Climate Change 2022: Impacts, Adaptation and Vulnerability. Contribution of Working Group II to the Sixth Assessment Report of the Intergovernmental Panel on Climate Change. Edited by Hans-Otto Pörtner, Debra C. Roberts, Melinda Tignor, Elvira Poloczanska, Katja Mintenbeck, Andrés Alegría, Marlies Craig, Stefanie Langsdorf, Sina Löschke, Vincent Möller, Andrew Okem, Bardhyl Rama, 2233–2272. Cambridge University Press. https://tinyurl.com/4bn6kdkw
Argov, Eyal and Shay Tsur. 2019. A Long-Run Growth Model for Israel: Discussion Paper no. 2019.04. Bank of Israel, Research Department. https://tinyurl.com/y8xfkzc3
Bank of Israel. 2019. 2018 Report, 25-36. https://tinyurl.com/42s329zz [Hebrew]
Ben Moshe, Eliahu. 1989. “Marriage Squeeze and Marriage Patterns in Israel.” In Jewish Population Studies - Papers in Jewish Demography 1985. Edited by Usiel Oskar Schmelz and Sergio Dellapergola, 87-95. The Institute of Contemporary Jewry, The Hebrew University of Jerusalem. Magnes Press
Bloom, David and David Canning. 2004. “Global Demographic Change: Dimensions and Economic Significance.” In Global Demographic Change: Economic Impacts and Policy Challenges, Proceedings of a Symposium [sponsored by the Federal Reserve Bank of Kansas City, Jackson Hole, Wyoming, August 26–28, 2004], 13. https://tinyurl.com/2dmk2f4s
Bloom, David, David Canning, and Jaypee Sevilla. 2003. The Demographic Dividend: A New Perspective on the Economic Consequences of Population Change, 1–106. RAND corporation
Coale, Ansley J., Paul Demeny, with Barbara Vaughan. 1983. Regional Life Tables and Stable Populations, Second Edition, 1-496. Academic Press.
Coale, Ansley J. and Edgar M. Hoover. 1958. Population Growth and Economic Development in Low-Income Countries – A Case Study of India's Prospects, 18-25. Princeton University Press.
Cruz, Marcio and S. Amer Ahmed. 2018. “On the Impact of Demographic Change on Economic Growth and Poverty.” World Development 105: 95–106. https://doi.org/10.1016/j.worlddev.2017.12.018
European commission. 2022, April 27. Attracting Skills and Talent to the EU - Communication From the Commission to the European Parliament, the Council, the European Economic and Social Committee and the Committee of the Regions. COM (2022) 657 final. https://tinyurl.com/y5fwx6ej
Friedlander, Dov. 1975. “Mass Immigration and Population Dynamics in Israel.” Demography, 12(4): 581-599. https://doi.org/10.2307/2060715
Keyfitz, Nathan. 1971. “On the Momentum of Population Growth.” Demography, 8(1): 71-80. https://doi.org/10.2307/2060339
Lutz, Wolfgang, Jesus Crespo Cuaresmaa, Endale Kebedea, Alexia Prskawetza, Warren Sandersona and Erich Striessnig. 2019. “Education Rather than Age Structure Brings Demographic Dividend.” Proceedings of the National Academy of Sciences (PNAS), 116(26): 12798–12803. DOI: 10.1073/pnas.1820362116
Mason, Andrew. 2007. “Demographic Transition and Demographic Dividends in Developed and Developing Countries.” In United Nations Expert Group Meeting on Social and Economic Implications of Changing Population Age Structures. Mexico City, 31 August – 2 September 2005, 81-101. United Nations. https://tinyurl.com/k5hv8nht
Misra, Roli. 2015. “Impact of Demographic Dividend on Economic Growth: A Study of BRICS and the EU.” International Studies, 52(1–4): 99–117. https://doi.org/10.1177/0020881717714685
Potter, R.G., O. Wolowyna and P.M. Kulkarni. 1977. “Population Momentum: A Wider Definition.” Population Studies, 31(3): 555-569. https://doi.org/10.2307/2173374
Shraberman, Kyrill and Alexander A. Weinreb. 2024. “The Fiscal Consequences of Changing Demographic Composition: Aging and Differential Growth Across Israel’s Three Major Subpopulations.” The Journal of the Economics of Ageing, 27(1): 100500. DOI:10.1016/j.jeoa.2023.100500
Sate Comptroller. 2021, 26 October. Government of Israel Actions and Preparation for the Climate Crisis. Special report. https://tinyurl.com/578964mt [Hebrew]
Taub Center. 2020, November 24. A Recap of our 2020 Annual Herbert M. Singer Conference - Israel’s Unique Demography – Implications and Planning for the Future.
. YouTube. https://tinyurl.com/bdhe2m9r
United Nations. n.d. World Population Prospects 2022. https://tinyurl.com/y8x76am4
_________
[1] In the literature the “dependence ratio” is sometimes used, which measures the ratio between the dependent population (the elderly and children) and the working age population, instead of the proportion of the population of working age. These two measures are equivalent but it is correct and simpler to use the proportion of the population who are of working age.
[2] All statistics in this chapter and the following chapters are taken from publications of the Central Bureau of Statistics, primarily from the Statistical Yearbooks for the years 1949-2022.
[3] The population momentum effect is the tendency of a population with a high fertility rate that grew rapidly, to continue to do so for decades even after the onset of a significant decline in fertility.
[4] This turn of events resulted from the change in the fertility trend: In the early 1990s the fertility rate stopped declining after 30 years, and during the years 2005-2018 it even rose by one-quarter birth, from 2.84 to 3.09.
[5] In the labor market young and old people are active, but the rates of labor force participation of those below aged 20 and above aged 64 are very low in comparison to the participation rate of those aged 20-64. It has been found that the two types of dependence (dependence of children and dependence of the elderly) are not fundamentally different in relation to the net “burden” on the working age population (Taub Center 2020). Therefore it is possible to understand relatively well the effect of changes on per capita income if we observe the proportion of the population aged 20-64 as representing the primary working age population, without analyzing separately the two groups of dependents.
[6] In 1951 the proportion of those born in Europe and America amongst those aged 65 and up was estimated at 73%, and in 1963 at 69%.
[7] For the years 1950-1954, during which the CBS did not publish any statistics about the age structure of the Arab population, the calculation is based on the assumption that the age structure of the Arab population that was published for 1955 was fixed at this level during the years 1950-1954.
[8] The fertility rate, like all other indices in this work, is an average for the entire Israeli population and not just the Jewish population, which as a majority has a more dominant effect than minority groups. For this purpose, regarding the years 1950-1954 when the CBS did not publish fertility statistics for the Arab population, the rate is based on the assumption that the fertility rate of the Arab population that was published for the year 1955 was fixed at this level during the years 1950-1954. During these years the percentage of Arabs in the total population was estimated at below 12%, so that even if this assumption is challenged, its impact on the total population fertility rate would remain minor.
[9] 71% of those aged 65 and up in 1989 were born in Europe.
[10] Based on the statistics published by the CBS (in the 2006 Statistical Yearbook) for immigrants who arrived between 1990-2005 and the children they brought with to Israel, we can estimate the effect of the immigration during these years on the age structure of the population. It becomes clear that these immigrants contributed to a 0.9% increase in the working age population, which is one-quarter of the total 3.6% increase in this sector from 1989 to 2005. This increase was accompanied by a -1.9% decline in the number of children born and an increase of 1.0% in the number of people of old age.
[11] This may be linked to the fact that these were in large part children born during World War II, when fertility rates in Europe were very low, who replaced those born during the period between the two world wars. Throughout this entire period most of those aged 65 and above were of European origin: 66% in 2009, 60% in 2010.
[12] Separation of these three groups is due to their highly distinctive demographic patterns (particularly fertility and migration), and allows for the best analysis of potential changes in the age structure of the entire population, which is the focus of our work. See methodology and assumptions of the population forecasts on the CBS website, Israel Population Forecasts 2015-2065. [Hebrew]
[13] These were calculated on the basis of the assumptions regarding the three population subgroups that serve for the construction of the population forecasts and express the fertility rate of the general population for each forecast year.
[14] The model weighs demographic variables together with a variety of economic indices. Amongst other things, the model takes into account the potential contribution of workers with foreign citizenship and Palestinian workers.
[15] 1.9 births per woman on average in Asia and Latin America, 1.6 in Europe, 1.5 in North America. Only in African countries is fertility very high, at 4.4 births per woman, according to the UN world population forecast statistics database for 2022 (United Nations n.d.).
[16] Fertility rose slightly in 2021, but this may be connected to the Covid pandemic.
[17] The decline was also recorded amongst the Jewish population and not only amongst the Arab population, where fertility continues to decline.
[18] The ultraorthodox population of working age is estimated at half a million people (10%) in 2015, but by 2065 their number will grow to over 2 million (between 2.2 and 3.2 million, based on the different forecasts), who will make up over 25% (between 26%-30%) of the working age population. This population has low workforce participation and low productivity (see Bank of Israel 2019; Argov and Tsur 2019; Shraberman and Weinreb 2024), and therefore this growth is a highly important future challenge.
[19] Israel is in a region defined as a “hot spot” (high risk region) and is therefore more exposed to the risks of climate change (State Comptroller 2021; Ali et al. 2022, 2235).