

Strategic Assessment
This article presents the trends in the demographic development of the population in the western side of the biblical Land of Israel in general and the State of Israel in particular and shows that there is no basis to claims regarding the danger of the Jews gradually becoming a minority in the land. From the moment that the Zionist movement began to translate ideology into action, the positive migration balance was a decisive factor in the formation of a Jewish majority in the land. At the same time, there was a continual negative migration balance among the residents of what came to be the Palestinian Authority, which began in the days of Jordanian rule of Judea & Samaria and Egyptian rule in the Gaza Strip.
Learned opinions that prophesied inevitable failure for the Zionist project relied on fertility and mortality figures relating to the Jewish and Arab inhabitants of the land and ignored the dimensions of Jewish immigration (Aliyah) to Israel. Analysis of the demographic data for the years 1948-2022 shows that since 2016 the overall fertility of Jews in Israel has been higher than that of the Arabs, and the proportion of Jews in the population of the western Land of Israel is expected to increase from the fourth decade of the twenty-first century. According to the CBS, by 2065 the proportion of Arabs in the population of Israel is expected to decline. This trend could become stronger if a negative migration balance emerges among Israel’s Arab citizens, as has been the case among the Arabs of Judea & Samaria and the Gaza Strip for many years.
Key words: demographic development, demographic revolution, fertility, migration, Aliyah, life expectancy, birthrate
Introduction
The purpose of this article is to present trends in the demographic development of the population in the western side of the biblical Land of Israel in general, and of the State of Israel in particular. The article shows that there is no basis for claims regarding the danger of Jews becoming a minority in the land. From the nascent years of Zionist activity, the positive migration balance was a decisive factor in the formation of a Jewish majority in the land. In 1878 the Jews in Palestine numbered 25,011, or 5.83% of the total population (Beinin et al. 2014). Zionist activity brought about a demographic revolution whereby Jews became an absolute majority, and in 1972 they accounted for 64.84% of all residents of the western Land of Israel, from the Jordan River to the Mediterranean coast (CBS 1987). At the same time, there was a continuation of the negative migration balance among the residents of what would later be termed the Palestinian Authority, which began in the days of Jordanian rule of Judea & Samaria and Egyptian rule in the Gaza Strip.
Nevertheless, there were learned voices that predicted unavoidable failure for the Zionist project. They relied on fertility and mortality figures for the Jewish and Arab residents of the country, while ignoring the dimensions of Jewish Aliyah to Israel, which in the opinion of some, would gradually decline and even disappear. For example, according to Prof. Arnon Soffer, “So without even considering future birth rates, to make up one percentage point today we need an additional 170,000 Jews. Who among us really expects that sort of aliya in the near future?”Petreanu 1988). Contrary to this opinion, in the years 1988-2023 there were 1,659,491 immigrants to Israel (CBS 2023a).
On the decline in Aliyah, it was written that “the latest available data already show that the rate of incoming immigration declined substantially in October. If this continues to the end of the year, the total number of immigrants to Israel in 2023 will plummet to the level of the years 2018-2019, namely 35,000 immigrants, more or less” (Weinreb 2023, 15). But the reality was different, because “During 2023 some 45,000 new immigrants arrived in Israel”—35.3% higher than the forecast (CBS 2023d).
Analysis of the demographic data for the years 1948-2022 shows that since 2016 the overall fertility of Jews in Israel has been higher than that of Arabs. At the same time, and together with a decline in the Arab birthrate, there has been a rise in mortality due to the aging of the “baby boomer” generation, born in the 1950s and 1960s in Israel, and the 1970s in Judea & Samaria and the Gaza Strip. This has led to a gradual decrease in the natural increase in the Arab population, and the proportion of Jews in the population of the western Land of Israel is expected to increase from the fourth decade of the twenty-first century.
According to the CBS forecast (CBS 2019), by 2065 the proportion of Arabs in the population of Israel is expected to decline from 21.2% in 2022 to 18.4% according to maximal estimates, or to 19.3% according to the moderate option. The proportion of Arabs in the 0-4 age group in Israel is expected to drop from 23.7% to 14.4%. This downward trend could become stronger if a negative migration balance emerges among Israel’s Arab citizens, as is the case among the Arabs of Judea & Samaria and the Gaza Strip.
The first parts of this article present data on the annual growth of Israel’s population by sectors, on birthrates, life expectancy and total fertility, with a discussion of the influence of Aliyah to Israel on demographic changes. This is followed by a review of the Arab population of Judea & Samaria and the Gaza Strip plus migration from these areas. Finally, the question is raised of how many Jews and Arabs will be living within the Land of Israel in 2065.
Annual Growth of the State of Israel Population by Sector
According to the Central Bureau of Statistics (CBS), in 2023 the population of the State of Israel numbered 9,842,000 (CBS 2024a). The wider Jewish population (or the Hebrews)[1] numbered 7,762,700 people, of whom 7,208,300 are Jewish and 554,400 are people who immigrated to Israel in the framework of the Law of Return and are not classified by religion.
The population defined as Arab numbered 2,079,300, of whom 1,783,840 are Muslims, including some 15,000 Tatars (Bernowsky 2009), some 5,000 Circassians and some 295,460 Druze and Christian Arabs. The Christian Arab figures include about 12,000 members of the Aramaic ethnic group whose nationhood was recognized by the Interior Ministry in 2014 (Halul 2015), as well as some 6,000 Armenians.
In 1996, the gap between the Jewish population (4,616,100 people) and the Arab population (1,037,700 people) was 3,578,400. By 2023 the gap had widened to 5,129,000 people.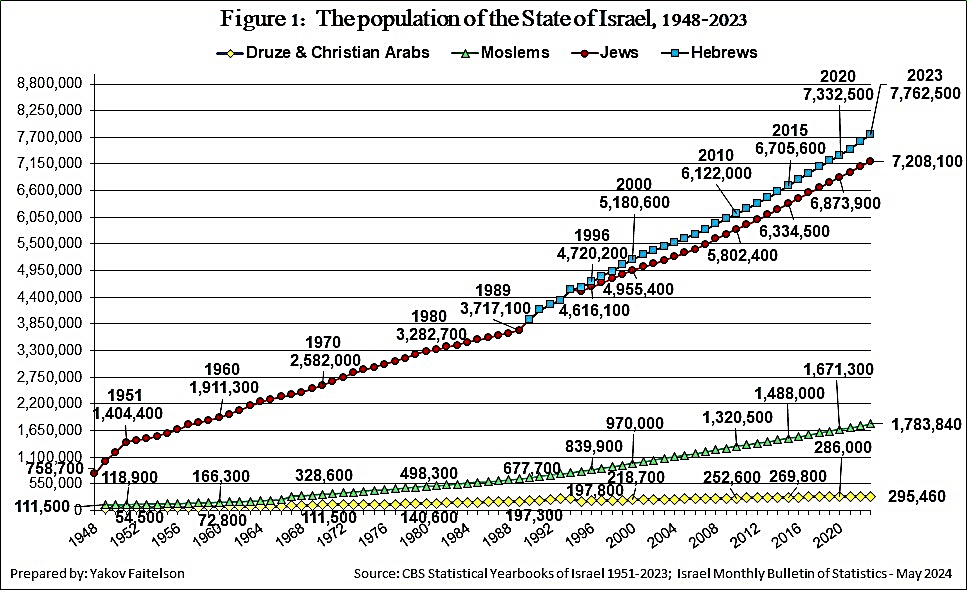
The proportion of Hebrews in the population fell from 82.0% in 1996 to a stable 78.9% in the years 2020-2023, while the proportion of Jews fell from 80.2% to 73.2%. A calculation of the polynomial trend shows that the proportion of Jews in the Israeli population will rise towards the second half of the fourth decade of the twenty-first century. The proportion of Muslims out of the total population in Israel rose from 14.6% in 1996 to about 18.1% in 2023, while the proportion of Druze and Christian Arabs fell from 3.4% to 3.0%.
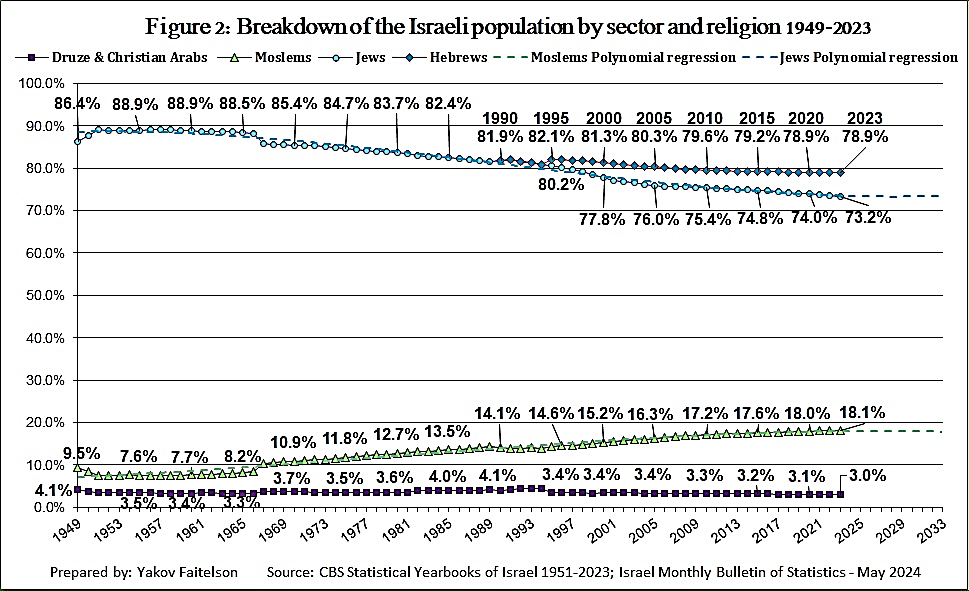
Figure 3 shows that over the past twenty years, the annual growth rate of the Arab population in Israel declined by 33.9%—from 3.01% in 2003 to 1.99% in 2023.
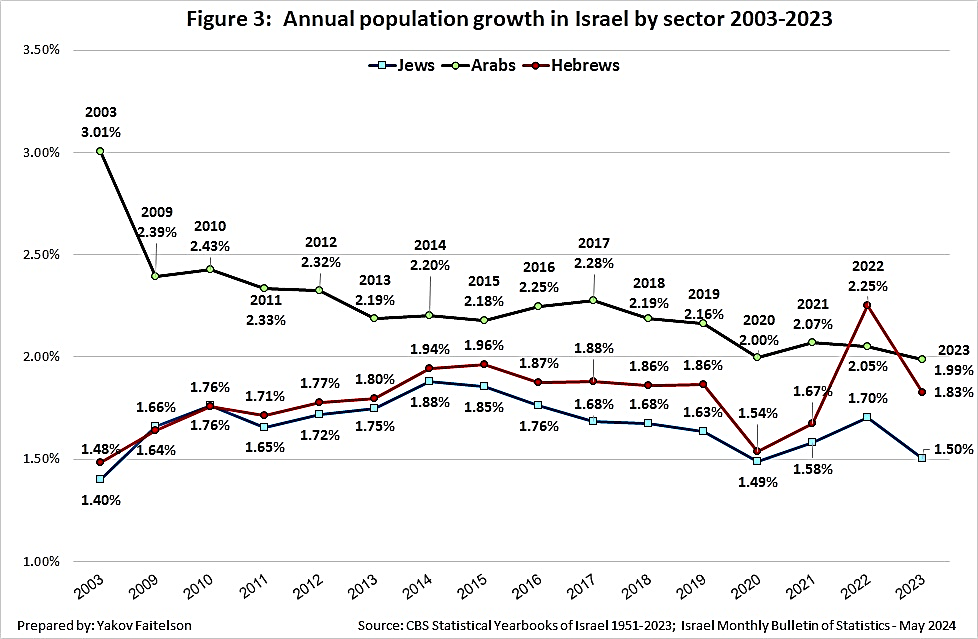
As we shall see later, the constant decline in the annual growth rate of the Arab population in Israel is due mainly to a drop in overall fertility.
In 2023 the Jewish population grew by 1.5%, while in most of the years from 2009 to 2022 the average annual growth rate was 1.70%. Among the Hebrew group, the growth rate in 2023 was 1.83%, compared to 1.48% in 2003. In most of the years from 2013 to 2023 the annual growth rate of the Hebrews remained steady at an average of 1.86%.
Fluctuations in the annual growth rates of the Hebrews in general, and the Jews in particular, were due both to changes in overall fertility and also to changes in the scope of Aliyah to Israel. The annual growth of the Jewish population in the years 2003-2013 was very close to that of the Hebrews, but from 2014 to 2019, the gap between them grew significantly. The annual growth rate of the Hebrews remained steady at an annual average of 1.87%, but at the same time the growth rate of the Jews fell by 13.3%, from 1.88% in 2014 to 1.49% in 2019.
In 2022 there were 74,414 new immigrants, and the rate of growth among the Hebrews was 2.26% that year—some 32.9% higher than the annual growth rate of the Jews, and even 10.2% higher than that of the Arabs. This development indicates a trend of increasing numbers of immigrants included in the figures for the population not classified by religion.
Birthrates in Israel by Population Sector
Among the Jews
After 1955 the Jewish birthrate rose by 77.3%, from 42,339 births to 75,066 live births in 1976. From then until the end of the 1980s the number of live births in the Jewish population stabilized at an annual average of about 73,000 live births.
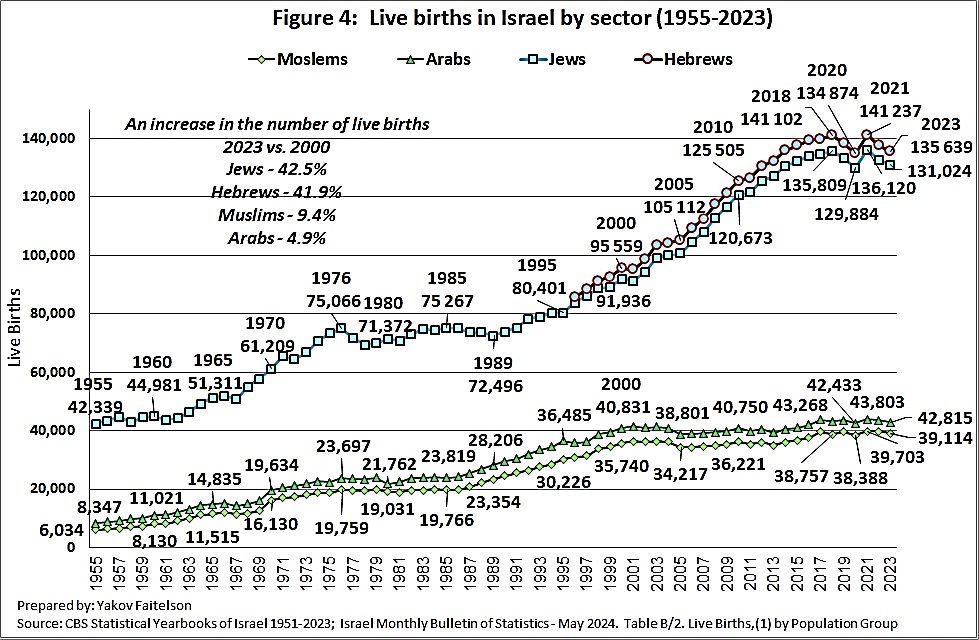
From 1990 onwards, the number of births among Hebrews rose constantly and in 2021 reached an all-time high of 141,237 births, of which 136,120 were to Jewish mothers (CBS 2024b). As of 2023 there were 135,639 live births among Hebrews—a decline of 4.0% in the rate since 2021 but higher by 41.9% than the rate in 2000. Among Jews there were 131,024 births, 3.7% less than the number in 2021 but 42.5% higher than the number in 2000.
As a result of the war that erupted on October 7, 2023, it is reasonable to suppose that there will be a further decline in the birthrate of the Jewish population in 2024. Once the fighting ends and most of the soldiers return home, it is possible to expect the birthrate to rise again—typical of the outcome after every war. For example, after the War of Independence the total fertility rate of Jews rose from 3.43 births per woman in 1949 to 4.02 in 1951.
After that there was a decline in overall fertility, but the trend was reversed after the Six Day War (1967). Prof. Marjorie Honig pointed to the link between the fall in economic activity at the time of the Six Day War in Israel and the drop in fertility, and noted that when money and resources are meager, the birthrate falls (Honig 1974). After the war, the Jewish fertility rate rose for a number of years and then fell, but after the Yom Kippur War (1973) it rose again.
From 1975 to the First Lebanon War (1982), fertility fell and then once again increased after the war. This pattern is expected to be repeated this time as well. “In view of the war currently raging in Israel, the downward trend could be frozen for a few years, particularly among Jews, since an increased birthrate is a common phenomenon after wars” (Weinreb 2023, 10).
Among the Arabs
From the 1950s to 1976 there was a “baby boom” among the Arab population of Israel. A contributory factor was the health service provided by the state to all residents. The number of Arab live births increased by 183.9%, from 8,347 in 1955 to 23,697 in 1976 (see Figure 4 above). After remaining steady in the years 1976-1985, the birthrate began to rise again, and in the years 2001-2012 stabilized around an average of 40,180 live births per annum.
From 2013 the number of live Arab births began to rise gradually, reaching a record of 43,803 births in 2021 (CBS 2024b). In 2023 the number of births fell to 42,815.
As shown in Figure 5, the average rate of live births among Arabs in the years 1952-1963 was 46.4 per 1000, and in 1964 it reached a record 50.28. After that it consistently declined, down to 34.31 births in 1981. In the years 1984-1994 it stabilized at an average of 32.65 births per 1000, while the rate in 1987 was the lowest for this period—31.36 births.
The birthrate was influenced by the “baby boomer” girls of the 1960s reaching the age of fertility. From 1995 to 2000 the rate of live births in the Arab sector again increased to around 35.50 per 1000. In 1998 it reached the highest rate since 1980—36.25 births, about 93.8% higher than the rate in the Jewish sector—18.70 births. The rate of live births per 1000 in the Arab sector in Israel fell continuously from 2000 to 2013, and stabilized at an average annual level of 23.61 live births until 2016, while since 2018 it has again declined, and in 2023 was down to 20.80 births—42.6% less than the rate in 1998, and only 13.7% higher than the rate among the Jews—18.30 births per 1000 people (CBS, 2024b).
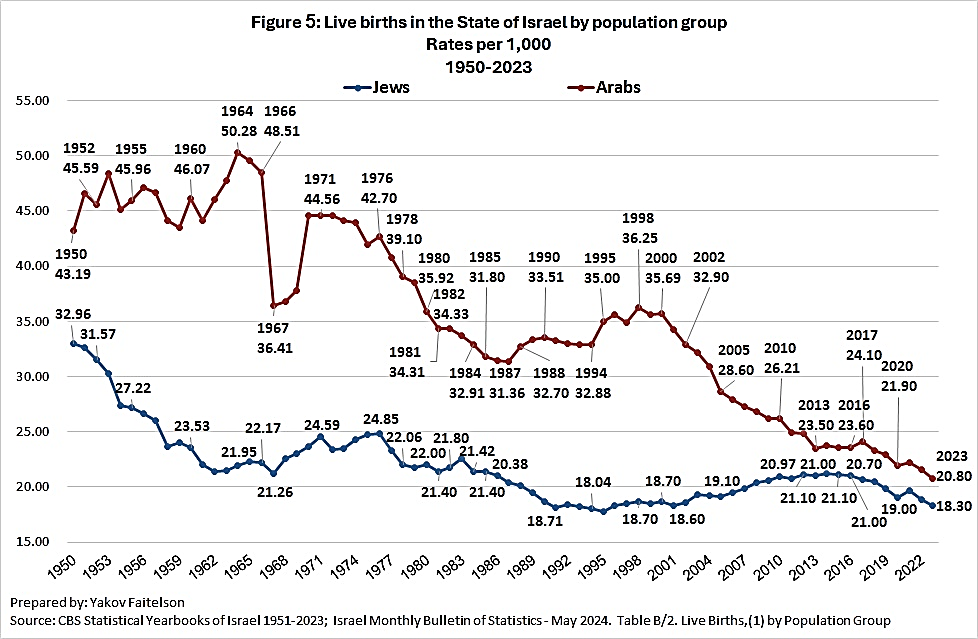
The proportion of Jews in the total live births in the State of Israel in 2023 was 73.42%—10.0% higher than in 2001. Among the Arabs it rose by 9.09%. By contrast, the rate of live births among the Arabs of Israel fell by 20.9% from 2001 to 2023.
Life Expectancy and Total Fertility
“Two mechanisms control the size of a population: life expectancy at various ages and the fertility rate” (Marchetti et al. 1996).
Life Expectancy
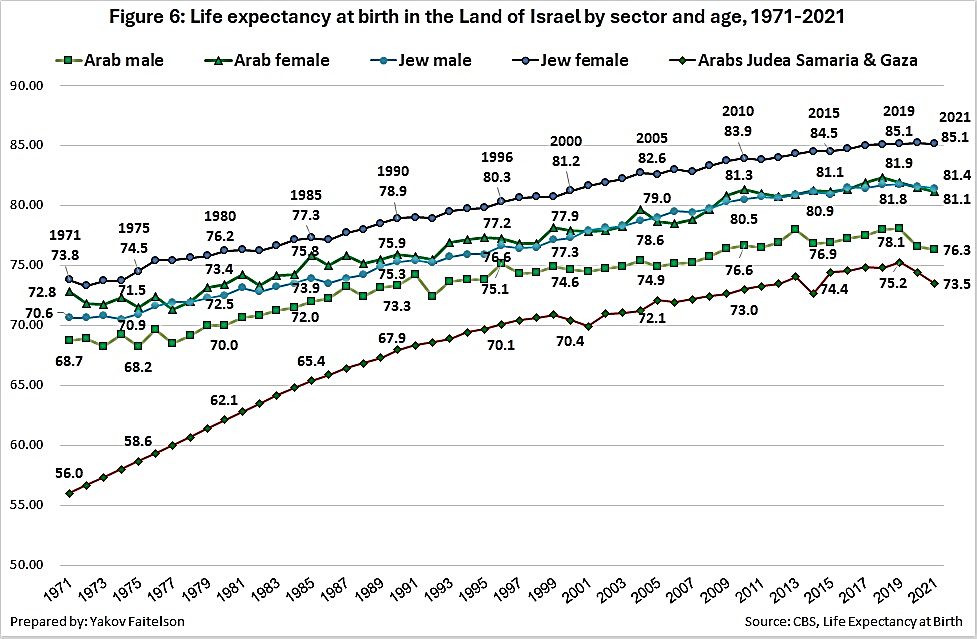
According to Figure 6 below, in 2022 the life expectancy for Jewish women was 85.1 years (compared to 80.3 in 1996), and for Jewish men it was 81.5 years (compared to 76.6 in 1996). Life expectancy for Arab women in Israel was 82.1 years (77.2 in 1996), and for Arab men it was 77.5 years (75.1 in 1996) (CBS 2023f).
According to figures from the World Bank, life expectancy for the Arab population in Judea & Samaria and the Gaza Strip in 1996 was 70.1 years, rising to 73.5 in 2021. (World Bank 2023).
From 1971 to 2021 the life expectancy of Jews increased by 15.0% and of Arabs in Israel by 11.0%. In the same period there was an increase in life expectancy of 31.3% among the Arabs of Judea & Samaria and the Gaza Strip; it is probable that this development was due to their exposure to Israeli health services.
Total fertility provides a basis for describing future development in a population group. It is calculated by the number of children born relative to the number of women of child-bearing age in a given year. When total fertility is 2.1 children per women, the population size will remain steady. If it is higher than this rate, the population will grow, and if it is lower, the population will start to shrink.
A decline in total fertility characterizes all populations as they experience social, technological and cultural development of their country, and is particularly linked to a rise in the level of education and the move to crowded urban environments. It has been defined as a demographic transition in which birthrates gradually fall below mortality rates, the population ages and then gradually shrinks over time.
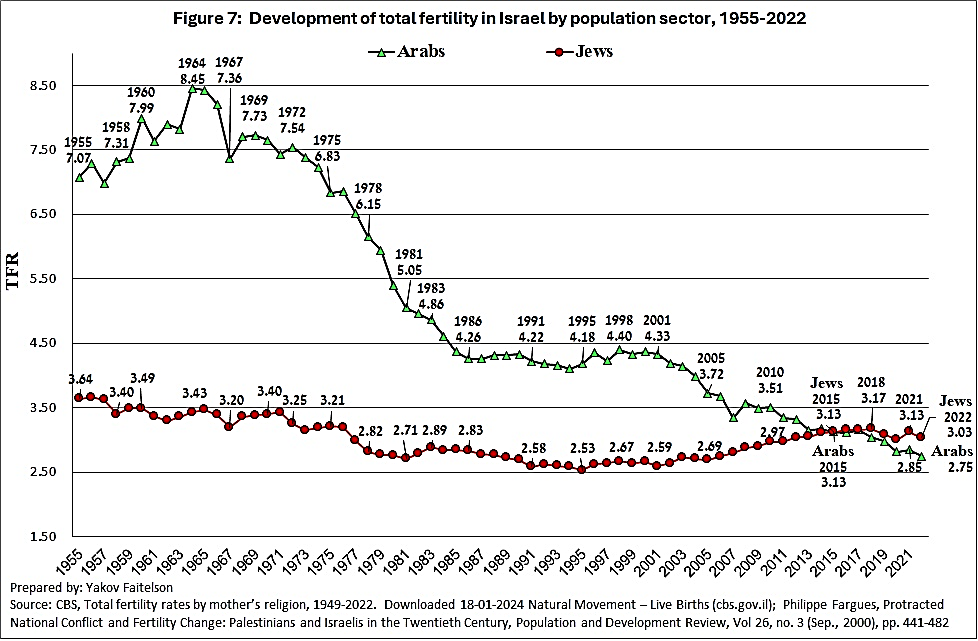
The peak of total fertility among the Arabs of Israel was in 1964—8.45 children per woman, almost 2.5 times more than the 3.43 children per Jewish woman (CBS 1970). Since then, total Arab fertility has declined and in 1994 stood at 4.10 children per woman—51.5% lower than the 1964 level (Fargues 2000). It rose again in 1998 to 4.40 and since then has constantly declined (see Figure 7).
Total fertility among Jews, which fell to 2.53 children per woman in 1995—its lowest ever level—has been steadily rising. In 2015 the total fertility of Jews and Arabs in Israel was 3.13 children per woman. Since 2016 the total fertility of Jews has been higher than that of Arabs, and in 2018 reached 3.17 children per Jewish woman—the highest rate since 1976. In 2022 the total fertility of Jews was 3.03 children per woman—10.2% higher than that of Arabs (2.75 children per woman) and even of Muslims (2.91 children per woman) (CBS 2023b).
Total fertility is influenced by the scope of migration since it is also a function of the number of women of child-bearing age who immigrate to the country. In 1991 the total fertility of immigrants from the former Soviet Union was 1.31 children per woman—51.5% lower than the total fertility of sabras (native Israelis) (CBS 1999). For that reason, the overall fertility of the Jews in Israel fell from 2.77 children per woman in 1988 to 2.53 children per woman in 1995.
This phenomenon is repeated with each new significant wave of Aliyah. Therefore, calculations referring to the total population of Israel which fail to consider the impact of the demographic features of new immigrant arrivals, create an erroneous picture when used to predict future population size.
In January 2024 it was announced that “during the period of Covid there was a slight rise in fertility rates in Israel, but in 2022 there was a return to the downward trend that began in 2018. The decline in fertility can be seen among Jews, Arabs and others, although fertility in the largest religious populations—Jews and Muslims—remained relatively high” (Taub Center 2024).
The decline in fertility of the large religious populations did not begin in 2018, and the rise in Jewish fertility during Covid was the outcome of demographic conditions before the outbreak of the pandemic. Figures from the last four years are not a basis for drawing long term conclusions, particularly when the trends among Jews are very different from the trends among non-Jews.
For example, we will compare the developments in fertility of two groups that are less influenced by the balance of migration: Israeli Muslims and sabras, who make up 79.9% of the Jews in Israel (CBS 2023e). As can be seen in Figure 8, until 2017 the total fertility of Israeli Muslims was higher than that of the sabras.
In the period 1978-2005 the total fertility rate of sabras was characterized by ongoing stability, at around 2.78 children per woman. In 2018, for the first time in the history of Israel, the total fertility of sabras exceeded that of Muslims, and continued to be higher. In 2022 the total fertility of sabras was 3.12 children per woman—7.2% higher than the Muslim rate (2.91 children per woman).
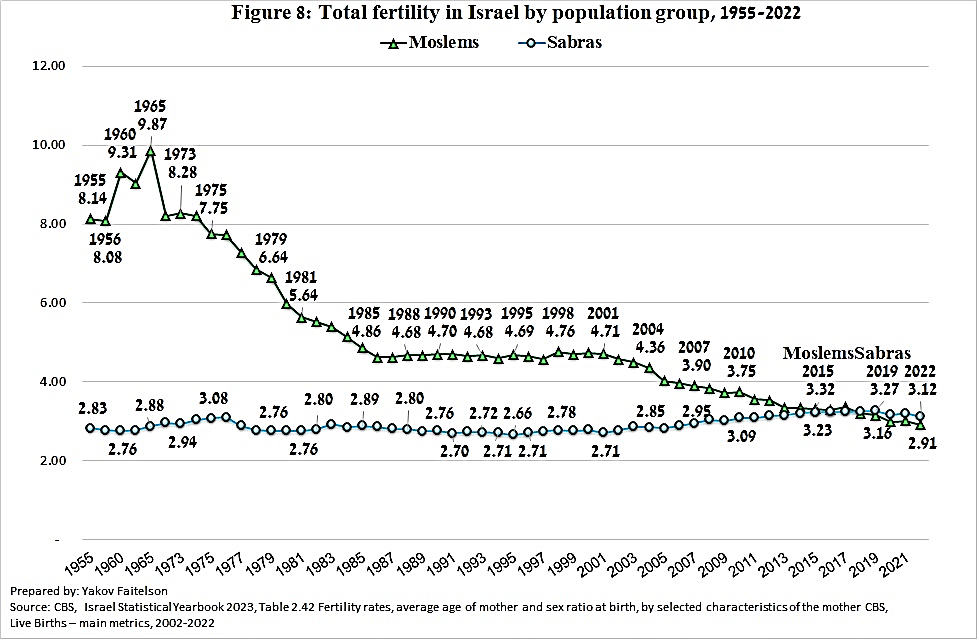
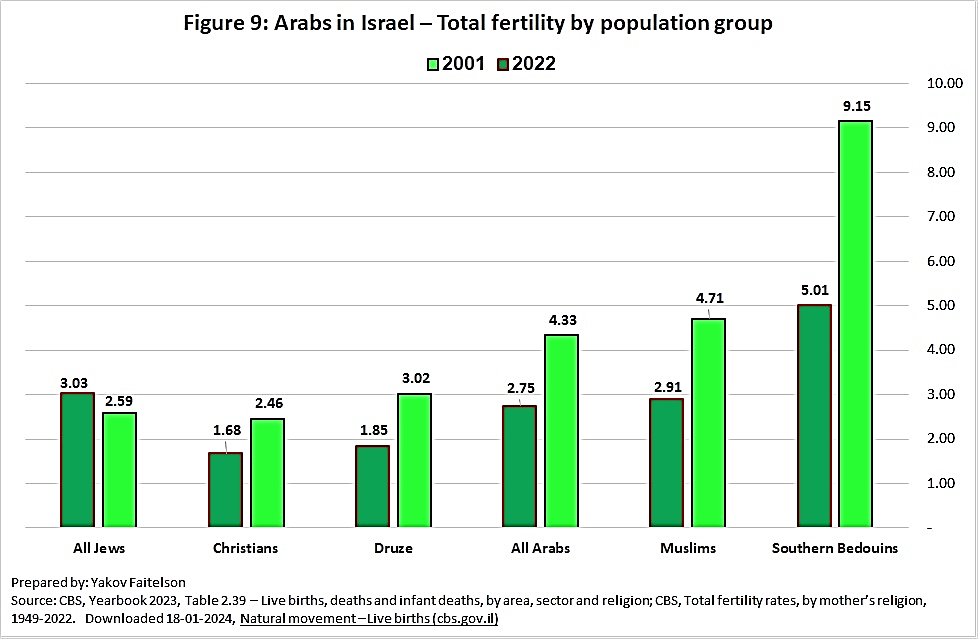
Figure 9 below shows that the total fertility of Arabs fell by 36.5% from 2001 to 2022, from 4.33 children per woman to 2.75, and among Muslims by 38.2%—from 4.71 children per woman to 2.91. The largest drop in fertility in the years 2001-2022 (45.2%) occurred among the Bedouin in the southern region. Among the Druze it fell by 38.7% and among Christian Arabs by 35.9%. By contrast, in the same period the total fertility of Jews rose by 17.0%.
Fertility of Jewish Women in Israel by Continent of Origin and Level of Religiosity
The largest increase in total fertility among population sectors by continent of origin in the years 2021-2022 was among the Jews of European origin—54.6%—who in 2022 constituted 11.8% of the Jewish population. At the same time, total fertility among Jews from the American continent rose by 28.7%, but among Jews from Asia it fell by 7.8%, and by 3.8% for Jews from Africa (CBS 2022).
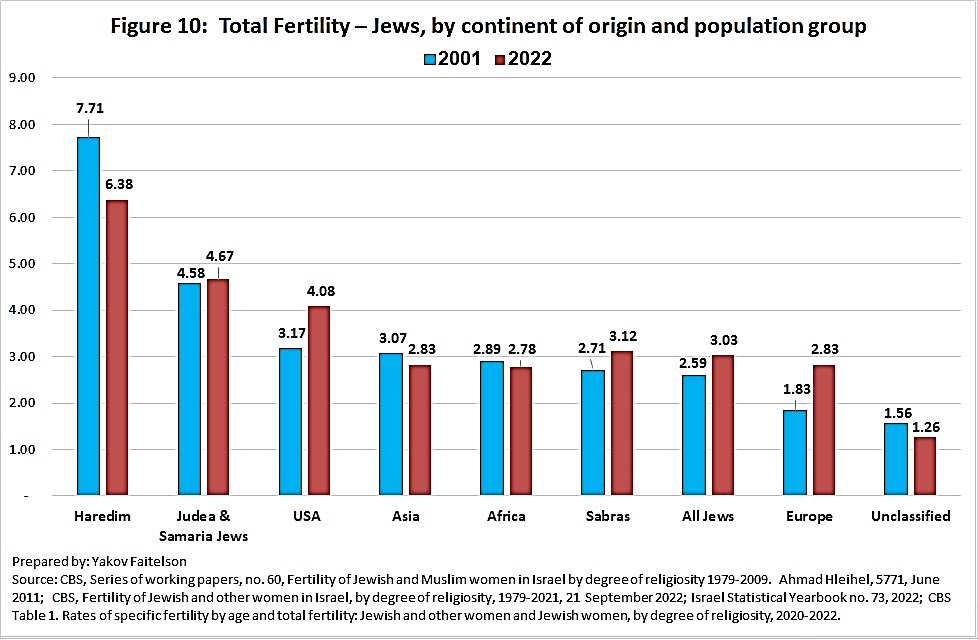
Following the recent increase in the number of immigrants who are not classified by religion, the total fertility in this group fell by 19.2%.
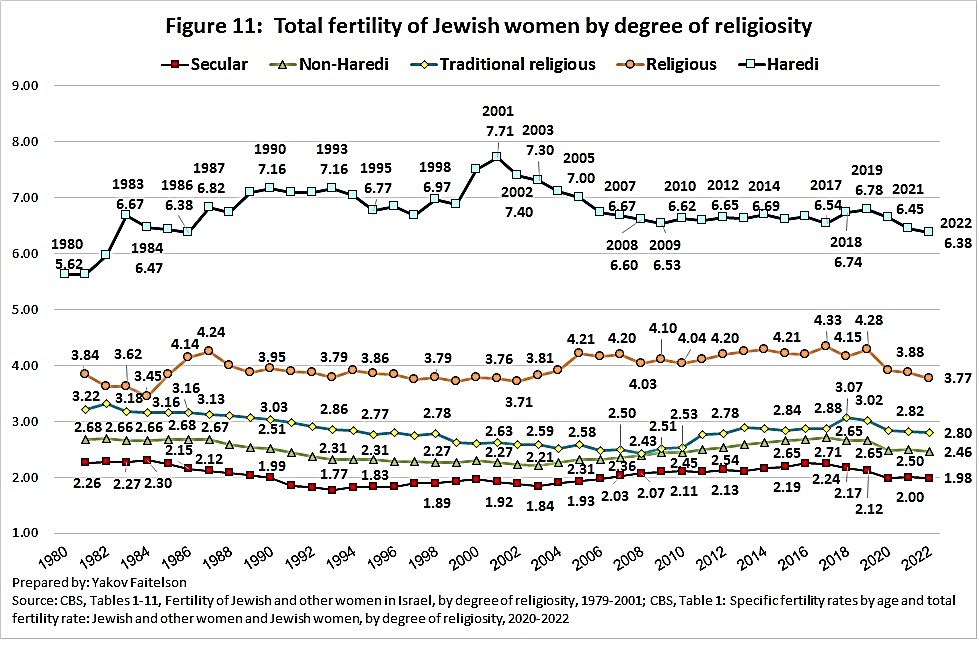
It is generally believed by the public in Israel that the growth in the Jewish birthrate in Israel is due to the high rate in the Haredi population, and indeed in the period 1981-2001, total fertility among Haredim rose by 37.2%, from 5.62 children per woman to an all-time high of 7.71 children per woman (Hleihel 2011) (See Figure 11 below). This very significant increase followed the taxation reform of the Ben-Shachar Commission, that was approved by the Rabin government in 1975. This reform “changed the method regarding children: instead of tax credits, they moved to a system of child benefits, which were increased” (Lan 2008).
In an annual review of focus groups in the field of sociology, it was reported that, “The major tax reform of 1975 quadrupled the allowances granted until 1969, with each child from the fourth on receiving a generous sum” (Focus Anthro 2007, 40). A situation was created where the larger the number of children, the less the need for the parents to work to support the family.
According to research by the Bank of Israel in 2009, the decline in birthrate in the years 2004-2007 was mainly due to cutbacks in child benefits:
In the years 2002-2003 there was a turnaround in welfare policy and child benefits were reduced beyond recognition. First the benefit updates were frozen, and then they were reduced by up to 15 percent. This very significant change in the child benefit structure was part of the June 2003 plan for the recovery of the economy (Toledano et al. 2009, 9).
As shown in Figures 10 and 11, total fertility among Haredi Jews in 2009 was 8.9% lower than in 2001, stabilized at an average of 6.64 children per woman until 2020, then fell to 6.38 children per woman in 2022, some 17.25% lower than the 2001 level. Apparently, the reasons for the decline in Haredi fertility rates “are linked to the social, cultural and economic changes affecting Haredi society […] One of the factors' driving change was the sharp reduction in child benefits” (Revhun & Malach 2008).
A similar conclusion was published in a review of focus groups in the field of sociology: “…legislation instituted by Finance Minister Benjamin Netanyahu in 2003 slashed benefits for large families and equalized payments for all children, regardless of birth order (Focus Anthro 2007, 40).
In December 2009 the Bank of Israel published the results of a study: “The research shows that full cancelation of child benefits would lead to a drop in overall fertility of Haredi women and of Bedouin women in the south” (Weiler-Pollack 2009). In 2000 the budget for payment of child benefits was 8.1 billion NIS and by 2008 it had fallen 37% to 5.1 billion NIS.
According to Dr. Gilad Malach, there is another reason for the decline in Haredi birthrates, the postponement of marriage age: “Girls are deciding to study toward a degree and are thus postponing marriage, which affects family size” As cited by Israel Kasnett: “According to forecasts, the fertility rate of the Haredi community, which dropped from 7.5 children per woman to 6.9 between 2003 and 2014, is expected to continue to decline, reaching 5.5 children per woman by 2025 to 2029” (Kasnett 2018).
Following the cuts in benefits, children ceased to be a significant source of income for the family, particularly for Haredim and Arabs in Israel. For that reason, “there was a demographic revolution among the Bedouin after the cuts in child benefits in November 2002 (Bistrov & Soffer 2007, 69). And indeed, total fertility among Haredim fell by 11.7%—from 7.22 children per woman in 2003 to 6.38 in 2022. Nevertheless, total fertility among all Jews rose by 11.0%—from 2.73 children per woman in 2003 to 3.03 in 2022 (CBS 2023b).
Unlike the decline in total fertility among Haredim, in all other Jewish population groups there was actually a rise in overall fertility. The fertility of religious women rose and stabilized at an average of 4.18 children per woman in the years 2005-2019—some 11.2% higher than in 2001, although after 2019 it began to fall and by 2022 had returned to the 2001 level.
Among traditionally religious women, total fertility in 2018 was 16.73% higher than in 2001 (CBS 2023b). From 2019-2022 it fell by 8.79% but was still 6.46% higher than in 2001. The total fertility rate of non-Haredi Jewish women in 2017 was 19.38% higher than in 2001. Among secular women it was 16.66% higher than in 2001. In 2022 the total fertility rate of non-Haredi Jewish women was 9.23% lower than in 2017, and among secular women it was 11.61% lower.
The large waves of Aliyah from countries in the former Soviet Union affected the total fertility rate in Israel, particularly among secular women, and in the years 1984-1993 it fell by 23.0%. This was due to the low total fertility rate that prevailed and still exists in their countries of origin, particularly among the local Jewish communities. Total fertility in Russia in 2022 was 1.42 children per woman, in Belarus 1.50 and in Ukraine 1.27 (World Population Review 2024).
In the years 2016-2022 total fertility among secular women again declined by 11.6% but was still 11.86% higher than the level in 1993 (CBS 2023b). However, the integration of the immigrants into Israeli society affected their fertility rate, which rose by 58.0%—from 1.31 children per woman in 1991 to 2.07 in 2014 (CBS 2016).
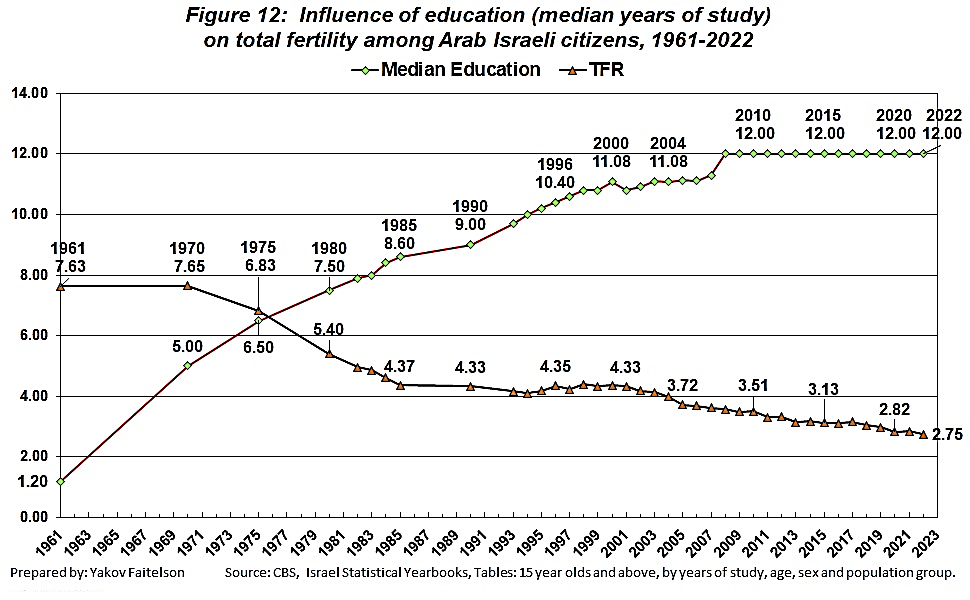
As I noted in a position paper in 2008, another factor that contributed to the fall in total fertility of the Arab population was female education (Faitelson 2008). I quoted a UN report that stated that “The more educated a woman, the fewer children she will bear” (UNFPA 1999). A recent publication stated that “A CBS study found that the higher the education of Bedouin women—the lower their fertility rate” (Kashti 2021).
In 1961 the median education among Israeli Arabs was 1.2 years of study and total fertility was 9.31 children per woman. By 2005 the median education increased to 11 years of study, and total fertility fell to 3.72 children per woman.
In a 2007 forecast I estimated that continuing improvements in the education of Arab women would bring the median education close to that of Jewish women (12.8 years), and accordingly the total fertility of Arab women would continue to fall, becoming close to the rate of Jewish women—2.75 children per woman.
As Figure 12 shows, this forecast was realized: median education for Arabs since 2008 has been 12 years of study, and total fertility was 2.75 children per woman in 2022.
Mortality by Population Groups and the Consequences of the Arab “Baby Boom”
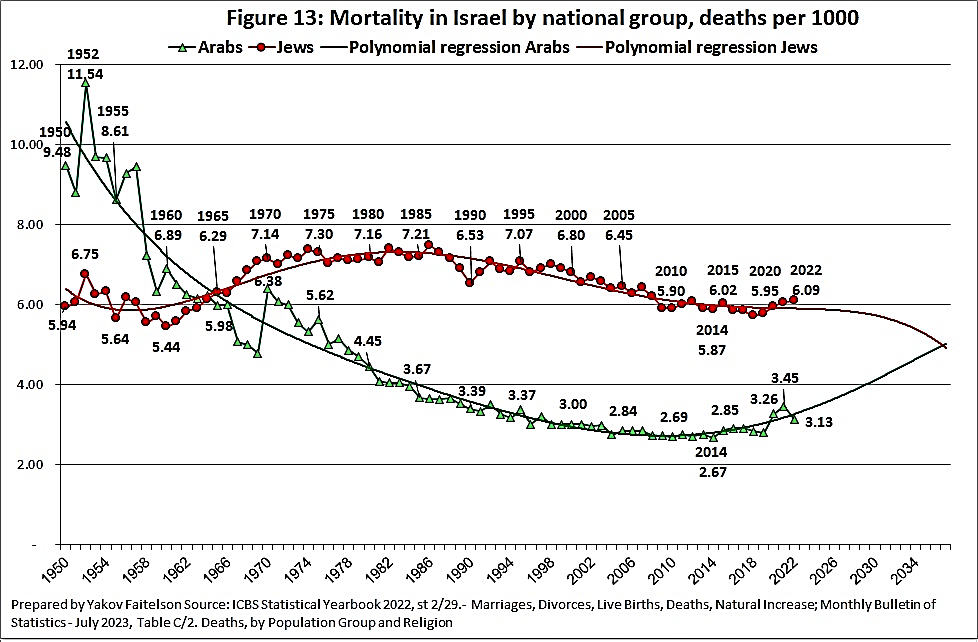
Figure 13 shows that mortality among Israeli Arabs was characterized by a rapid decline in the 1950s and 1960s, and thus contributed to the Arab demographic explosion. The mortality rate fell by 50%, from 11.54 deaths per thousand in 1952 to less than six deaths per thousand towards the end of the 1960s.
The drop in Arab mortality continued at a slightly slower rate until it reached its lowest point—2.67 deaths per thousand in 2014 (CBS 2023c). In 2021 mortality rates among Israeli Arabs began to rise, reaching 3.45 per thousand in 2021—the highest rate for thirty years. In 2022 the rate was 3.13—17.2% higher than in 2014.
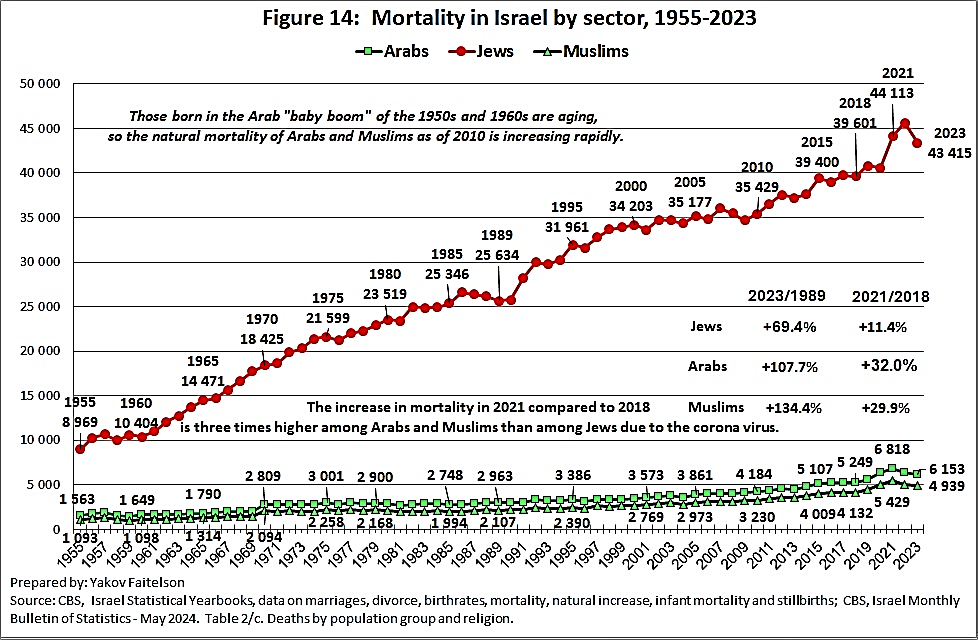
The aging of the Arab “baby boomer” generation of the 1950s and 1960s created a wave of deaths. Together with the ongoing fall in birthrates, this accelerated the decline in the natural increase of the Arab population (Petreanu 1988). As Figure 14 shows, in the period 2000-2023 the number of deaths among Arabs in Israel rose by 72.2%—from 3,573 in 2000 to 6,153 in 2023, and among Muslims by 78.4%—from 2,769 to 4,939. Among Jews the number rose by only 26.9%, from 34,203 to 43,415.
In 1989 deaths in the Arab sector accounted for 10.4% of all deaths in Israel, rising to 12.3% in 2023. This trend will intensify over time and also affects the fall in natural increase among Arabs and the drop in their proportion of the Israeli population.
A similar trend is developing, with a delay of about twenty years, among the Arabs of Judea & Samaria and the Gaza Strip. Together with the constant migration of young Arabs and the continuing drop in the birthrate, this could mean that by the middle of the fourth decade of this century the proportion of Arabs in the Land of Israel will fall.
The Arab Population of Judea & Samaria and the Gaza Strip
“Some who estimated the Palestinian population greatly over- or underestimated numbers in accordance with the estimators’ political intentions. All of these points must be kept in mind when any statistics on Palestinians are presented, including those presented here. All figures on Palestinian population are estimations.” (McCarthy 2001).
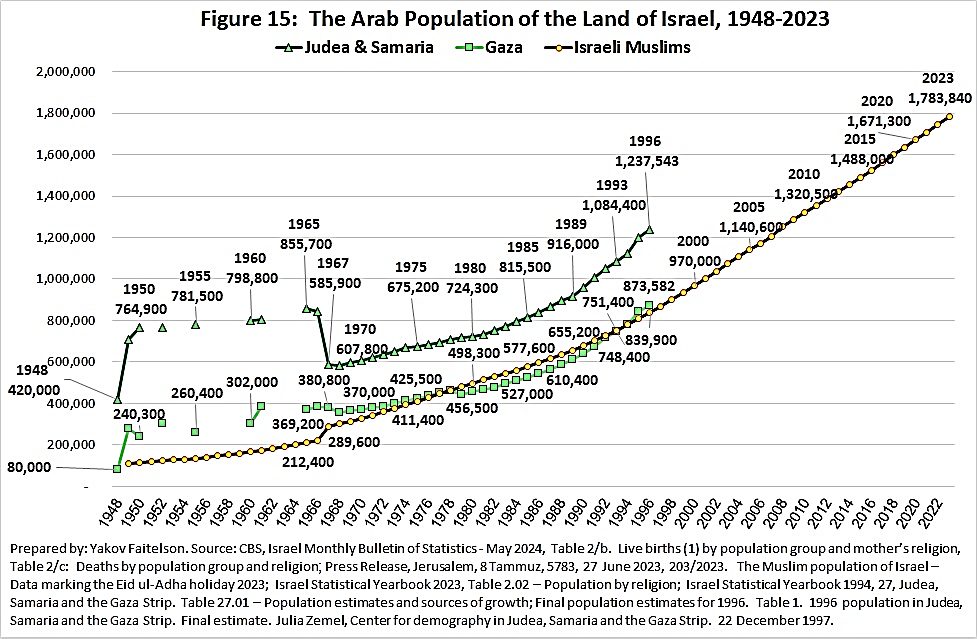
According to a CBS census of 1967, the population of Judea & Samaria numbered 585,900 plus 380,800 in the Gaza Strip—a total of 966,700 people. According to the final population estimates of the CBS in 1996, there were a total of 1,238,000 Arab residents in Judea & Samaria, and a further 873,600 in Gaza, a total of 2,111,600 residents (Faitelson 2003).
Thus, from 1967 to 1996 the Arab population of Judea & Samaria increased by 111.2%, or by annual geometric average, by 2.61% per annum, and in the Gaza Strip by 129.4%, or 2.80% per annum. If these growth rates were also true for 1997, then the Arab population of Judea & Samaria would number 1,269,843 plus 898,069 in the Gaza Strip, a total of 2,167,911 residents.
According to a Palestinian census of 1997, the Arab population of Judea & Samaria and the Gaza Strip numbered 2,895,683 (PCBS 1998), including 1,873,476 residents of Judea & Samaria—635,476 individuals or 48.6% more than the CBS figure for the end of 1996. In the Gaza Strip there were 1,022,207—namely 148,607 individuals or 17.0% more than the CBS figure. That means that the Palestinian census figures of 1997 were higher by 784,083 than the CBS figure for the end of 1996. Such a population growth in the space of only one year would not be possible without a serious humanitarian crisis, particularly in a region low in economic and administrative capability.
The PCBS figures for Judea & Samaria also include 193,000 Arab residents of East Jerusalem (CBS 1998). The Palestinian Authority also included in its records some 130,000 Arabs who received permanent resident status in the years 1994-2002 in the framework of the family reunification program following marriage to permanent residents in Israel (Rotman 2021).
In a discussion in the Sub-Committee for Judea & Samaria of the Knesset Foreign Affairs & Defense Committee chaired by MK Moti Yogev, on June 7, 2016, representatives of the Civil Administration said that they were only “maintaining” the PCBS figures on the Palestinian population. They also reported that the data includes all those who emigrated from the territories many years ago plus their children born abroad. (Faitelson 2018b). This created a cycle of data laundering, in which the Palestinian Authority figures were sent to the Ministry of Defense and then presented as data from the Israeli government, whose credibility was not in doubt. The reliance on these figures creates a cumulative error leading to mistaken and misleading demographic forecasts.
In fact, demographic data has become a weapon in the Arabs’ psychological warfare against Israel. The New York Times quoted Dr. Hassan Abu Libda, the head of the PCBS at that time, in the context of their first population census: “In my opinion, it is as important as the intifada. It is a civil intifada.” (Greenberg 1997).
The credibility of the Palestinian population data can be assessed from the following example: On December 21, 2017, the results of the first ever official census of Palestinians in Lebanon were published, showing that there were 174,422 Palestinians in Lebanon, far fewer than the 469,331 registered with UNRWA. According to the Lebanese prime minister at the time, Saad al-Hariri: “This is the real number […] We heard the higher numbers exploited for political [ends] and for sparring [with rivals], the government launched the census, and today we have correct results.” (MEMRI 2018).
In response to the census results, the UNRWA spokeswoman in Lebanon Huda Samra told the French news agency that “UNRWA does not have a headcount of Palestinian refugees who are currently residing in Lebanon. What we have as an agency are official registration records for the number of registered Palestine refugees in Lebanon. If someone registered with UNRWA in Lebanon decided to live outside Lebanon, they don't notify us” (AFP 2017).
The falsification of demographic data by Palestinians is not only typical of Lebanon. At a meeting of the Knesset Foreign Affairs & Defense Committee in March 2018, the deputy head of the Civil Administration announced that “the Palestinians include in their population register people who never lived in the West Bank. The Civil Administration believes that the Palestinian Authority issues passports born overseas to Palestinian parents and counts them as Palestinian citizens living under the Palestinian authority” (Berger & Khoury 2018).
Professor McCarthy wrote about the problematic nature of the results of the 1997 Palestinian census already back in 2001: “The census taken by the Palestinian Central Bureau of Statistics (PCBS) was partially a de jure enumeration […]. About 325,253 non-resident Palestinians were included.” (McCarthy 2001).
If we deduct the migrants, the residents of East Jerusalem, and the Arabs with permanent resident status in Israel from the PCBS census results, the population of Judea and Samaria and the Gaza Strip could be 2,247,430 in 1997, — 135,830 individuals, or 6.5% more than the number published by CBS at the end of 1996. However, this figure is 648,253 less than if we were to base our calculations on the results of the Palestinian 1997 census.
This practice of including migrants in the population registry is in direct contradiction with UN norms. According to these norms, staying outside the country of citizenship for more than 12 months results in the loss of permanent resident status and exclusion from the country's population register. Nevertheless, in Israel, the United States and other countries, authorities continue to rely on the data from UNRWA and the Palestinian Authority when determining the amount of aid they will provide to fund their activities.
For example, Prof. Arnon Soffer claimed that “In another five years Gaza will have a population of 2.5 million,” and that “The number of Palestinians in the West Bank is currently 2.5 million […] In another five years there will be 4 to 5 million Palestinians in Judea & Samaria” (Soffer 2006). This shows that the annual growth rate of the Arabs in Judea & Samaria and Gaza is 10-15% per annum. According to the World Bank, as of 2004, the world’s highest annual growth rate was in Eritrea—4.47% (World Bank 2021).
In my article, “Demography—threat or problem?”, I quoted from Shalom Achshav (Peace Now)’s 1992 Report no. 5, which stated that “the total number of Palestinians resident in the territories at the start of 1992 was about 1,960,000, of whom 1,200,000 reside in the West Bank and 760,000 in the Gaza Strip. About 260,000 are overseas. Together with the residents of East Jerusalem, at the start of 1992 there were about 1.2 million Palestinians under Israeli rule, including those currently overseas.”
In response to this, I wrote:
According to CBS figures from early 1992, 1,006,200 individuals are living in Judea & Samaria, about 193,800 fewer than the figure quoted by Shalom Achshav. According to the CBS, there were 676,000 individuals in the Gaza Strip, 94,000 less than the Shalom Achshav figure. It appears that Shalom Achshav inflated the numbers actually living in Judea & Samaria and the Gaza Strip in early 1992 with another 547,800 “ghosts” (Faitelson 2003, 4).
At a conference of the AEI Institute in January 2005, an American-Israeli demography research team presented a study on “The one million gap: The Arab population in the West Bank and Gaza.” The team’s findings matched the conclusions I reached in 2003 (Zimmerman et al. 2006).
Hagai Segal wrote in an article published in the newspaper “Basheva” on January 22, 2004:
Faitelson […] noted something very strange: during a period of record Aliyah from the former Soviet Union, the Palestinians actually managed to record a bigger record in the expansion of their population here.
According to their own calculations and UN data, over the nineteen nineties they doubled in number […] within 10 years, 19 percent more than the rate of growth of the Jewish population in those years of welcome immigration. In terms of natural increase this means 7 percent per annum, a fanciful rate by any standard.
I also told Segal that the Palestinian data included not only Arab migrants who had left Judea & Samaria and the Gaza Strip for at least a year but also some who had died, in order to continue enjoying the UNRWA payments received during their lives.
According to a CBS forecast published in 1986, by 2002 there should be some 2.4 million residents living in Judea & Samaria and the Gaza Strip, not including Jerusalem. “The currently accepted assessment in Israel is, as mentioned, three million people. Faitelson wondered from where another 600,000 Palestinians had suddenly appeared” (Segal 2004).
According to the Palestinian census held in 2007, the population of Judea & Samaria, including East Jerusalem, and of the Gaza Strip, was 3,761,126—an increase of 30% over the census results of 1997 (Ettinger 2008). This would indicate an annual growth rate by the average geometric calculation of 2.66% per annum.
According to the CBS data, at the end of 1996 there were 2,111,125 residents in the Palestinian Authority areas. Based on an annual growth rate of 2.66%, by 2007 this population should be 2,818,000—some 25% less than the figure given by the PCBS.
Figure 16 shows that the PCBS figures are characterized by inconsistencies and discrepancies that recur every year.
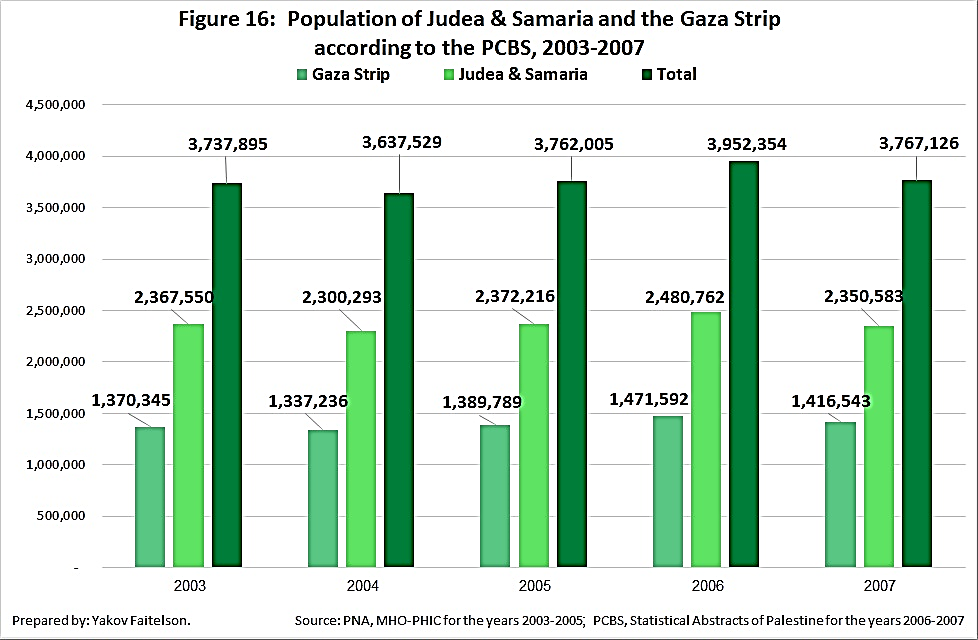
As an example, we will only note that the population of Judea & Samaria and the Gaza Strip in 2007 was only 0.8% larger than in 2003, and in effect identical to the number in 2005 (PCBS 2006, 2007; PNA, 2004, 2006a, 2006b; UNRWA 2010).
We note that according to the CIA’s World Factbook, as of 2023 the population of Judea & Samaria was 3,176,549, of whom 2,471,649 were Arabs, 468,300 were residents of Jewish settlements, and another 236,600 Jews were residents of East Jerusalem (World Factbook 2024). Based on the estimate of Prof. Soffer mentioned above, the Arab population in Judea & Samaria should have reached this level by 2006. According to CIA figures, the population of the Gaza Strip was 2,098,389 in 2023—some 400,000 less than Prof. Soffer’s forecast for 2011.
In 2010, reliance on the PCBS data led Prof. Sergio Della-Pergola to the following conclusions:
If we ask when the Jews will lose their majority, then it has already happened. If we combine the Palestinian population of the Gaza Strip and the West Bank, including foreign workers and refugees, whose numbers have mushroomed in recent years, and ignore Israelis who immigrated under the Law of Return but are not recognized as Jews by the Interior Ministry, then Jews are slightly less than 50% of the population (Shefler 2010).
According to CIA estimates, in 2023 there were 3,176,549 people in Judea & Samaria, including Arab residents of East Jerusalem, and according to their estimate for 2022—there were 468,300 Jews in Jewish settlements in the area, and 236,600 Jews living in East Jerusalem (The World Factbook 2024). And the Arab population of East Jerusalem was 370,500 (Yaniv 2023, 15).
We will deduct from the CIA estimate of 2023 the CBS figures for the Jewish population of the settlements and the East Jerusalem figures for Jews and Arabs, included in the Population Register of Israel. We will also deduct the 161,400 Arab migrants, according to CBS data for 1967-1994, the 231,666 migrants according to Civilian Administration data for 1995-2007,[1] and the 184,065 Arab migrants from Judea & Samaria according to the USCB for 2008-2022 (CBS 1997, Table 27.1; US Census Bureau 2024. West Bank). Consequently in 2022, the Arab population of Judea & Samaria numbered about 1,524,018 at the most.
According to the CIA estimate of 2023, the population of the Gaza Strip was 2,037,744 (The World Factbook 2024), but these figures include 317,118 people living abroad, including 109,900 migrants according to CBS data for 1967-1993, 108,582 migrants according to Civil Administration data for 1994-2007, and 98,636 migrants according to United States Statistic Bureau data for 2008-2022. If we deduct these numbers from the CIA data, we reach a population of 1,720,626 in Gaza. If we also deduct from the figures obtained from our calculations the 130,000 Arabs in Judea & Samaria and the Gaza Strip with permanent residency status in Israel, then the total population under the PA appears to be 3,245,000 at most.
In 1967 the proportion of Hebrews out of the total population of the western Land of Israel was 64.35%. In 2022, 55 years later, it had fallen to 58.01%. In 1967 Israeli Arabs were 10.60% of this population, rising to 15.52% in 2022. Arabs in Judea & Samaria were 15.82% of this population in 1967, falling to 13.38% in 2022. One of the main reasons for this was the continuing overseas migration of young Arabs from Judea & Samaria. Arabs in Gaza accounted for 10.28% of this population in 1967, rising to 13.09% in 2022.
In the period 1967-2014, the total fertility of the Arabs was higher than that of the Jews, but in 2015 the rates were the same. There was a revolution in the demographic situation in the Land of Israel, and since 2016 the total fertility of the Jews has exceeded that of the Arabs. Since 2020 this rate has also been higher than the total fertility rate of Muslims in the State of Israel.
Total Fertility of the Arabs of Judea & Samaria and the Gaza Strip
The fertility rate of Arabs in Judea & Samaria in 1991 was 6.44 children per woman—149.6% higher than the rate of the Jews, while in Gaza it was 8.13 children per woman—215.1% higher in comparison to 2.58 children per woman among the Jews in Israel (Fargues 2000).
It should be noted that the figures for total Palestinian fertility from different sources, and sometimes even from the same source at different times, significantly contradict each other. I indicated this fact in my article “The development of total fertility in the Land of Israel” (Faitelson 2018a).
For example, according to the PA Ministry of Health in 2005, total fertility in Judea & Samaria and the Gaza Strip fell from 4.39 children per woman in 1999 (4.1 in the West Bank and 5.0 in Gaza) to 4.19 (3.7 and 5.5 respectively) in 2004. Yet the same publication states that total fertility in Palestine according to the PCBS was 5.6 children per woman in 2004 (5.2 and 6.6 respectively). Therefore, the Palestinian Health Ministry figures for 2004 were lower than the PCBS estimates by 29% for Judea & Samaria and 17% for Gaza.
Let us compare the total fertility data from three estimates of the USCB for residents of Judea & Samaria with the figures for Israeli Muslims, and for the residents of Gaza with the total fertility of Egyptians. As can be seen in Figure 17, from 1998 to 2004, the total fertility of Muslims in Israel was higher than the estimates of the USCB for residents of Judea & Samaria. However, its estimates for 2022 and 2023 (the middle and top lines in the diagram) were far higher than the estimates from 2015 (the bottom line in the diagram). (US Census Bureau 2015. West Bank).
The USCB figures from 2022 for total fertility in Judea & Samaria were fairly close to the Israeli CBS figures for Muslims in Israel since 2005. In the years 2010, 2016, 2018, 2019 and 2021 they were identical or only slightly different.
By contrast, the USCB estimates from 2023 for Judea & Samaria were higher than its 2022 estimates, but the diagram shows that until 2012 the gaps between them were relatively small. And yet the USCB estimates from 2023 fell rapidly from 2013 onwards to 3.81 children per woman in 2018. Contrary to this, the total fertility of Israeli Muslims according to the CBS, and of the Judea & Samaria Arabs according to the USCB estimates of 2022 were identical—3.20 children per woman.
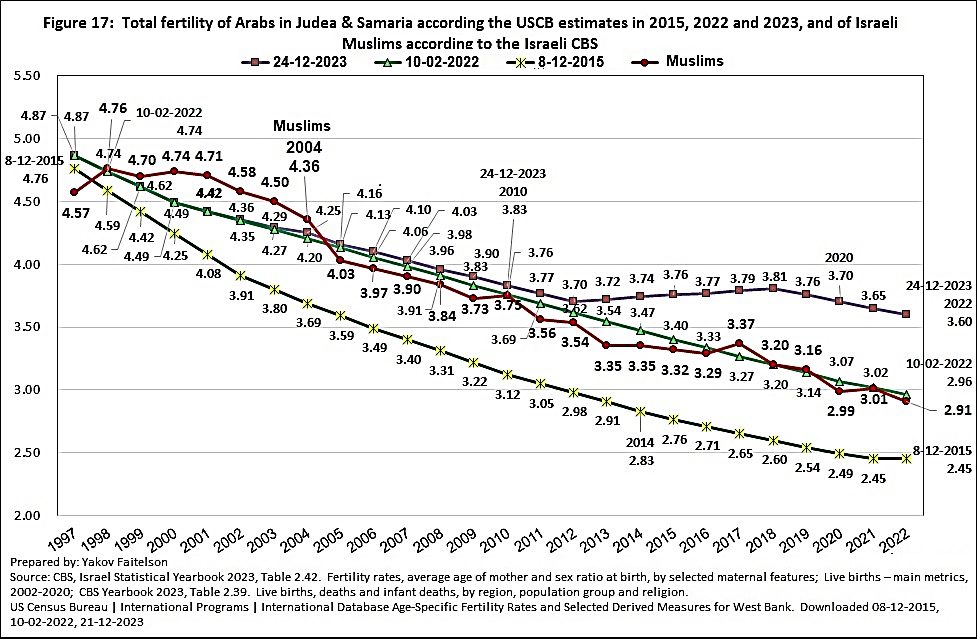
Table 18 below shows that according to the estimates of the USCB in 2015, total fertility in the Gaza Strip fell from 5.72 children per woman in 1997 to 5.34 in 2007. (US Census Bureau 2015. Gaza). According to the estimate of 2022, fertility stood at 6.20 children per woman throughout the years 1997-2007, but fell by 42.9% in the years 2007-2021, from 6.20 to 3.54, and according to the estimate from 2023, it fell to 3.60 children per woman. For the purposes of comparison, the total fertility of Muslims in Israel fell by 22.8% in 2021, from 3.90 in 2007 to 3.01.
For most years the USCB estimate of 2015 was far higher than the total fertility of Israeli Muslims and Egyptians. According to this estimate, from 2007 onwards, total fertility in Gaza fell rapidly to 4.24 children per woman in 2014—20.6% lower than the estimate of 2007. According to the 2015 estimate, total fertility in Gaza in 2022 should have been 2.9. The total fertility of Israeli Muslims that year was supposed to be 2.91 and of Egyptians 2.88 (Database. Earth 2024).
The USCB estimates of 2022 and 2023 for total fertility in the Gaza Strip were entirely identical for the years 1997-2013. After that there were some insignificant differences between the two estimates, but in 2022 the total fertility in Gaza, according to the 2023 estimate, was supposed to be 3.50 children per woman—43.5% lower than the level of 1997. The total fertility of Muslims in Israel in 2022 was 35.5% lower than 1997 and in Egypt it was 21.1% lower.
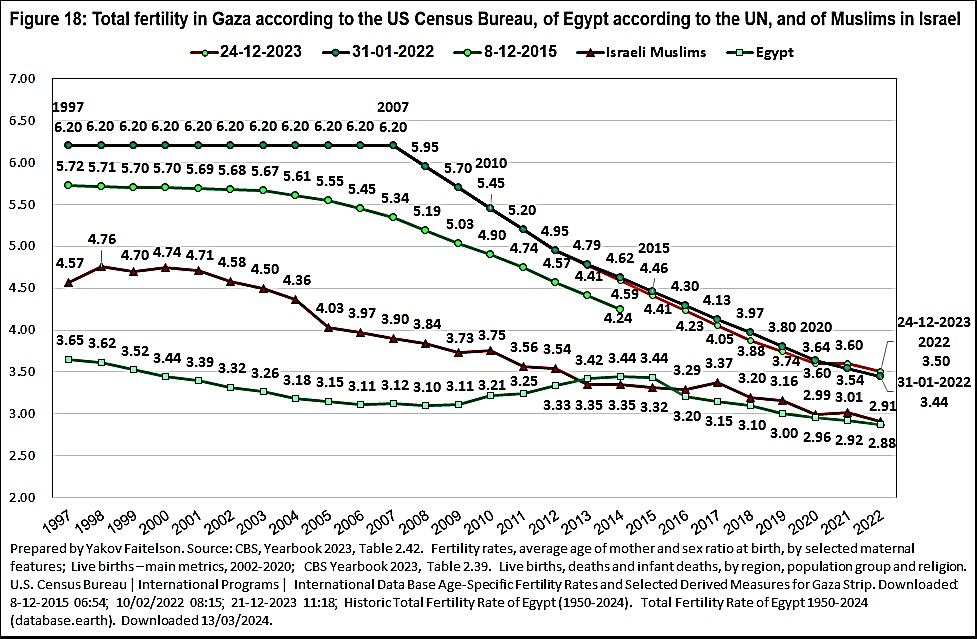
It should be noted that in 2022 the total fertility of Jewish residents of Judea & Samaria was 4.67 children per woman, and of Jewish residents of Jerusalem it was 4.45—far higher than all the USCB estimates regarding the Arabs of Judea & Samaria and the Gaza Strip. From the foregoing it appears that all sources indicate a consistent trend of a decline in fertility of Arabs in all parts of the Land of Israel and in Egypt.
Arab Migration from Judea & Samaria and the Gaza Strip
Arab migration from the Land of Israel did not start in 1967 following Israel’s victory in the Six Day War. In all the sources that were examined—the Israeli CBS, the USCB and UN publications—the balance of Arab migration from Judea & Samaria was generally negative, even under Jordanian rule 1950-1966, and in Gaza under Egyptian rule at the end of the 1960s.
According to Prof. Janet Abu-Lughod in 1986, by 1950 some 122,500 Arabs had already moved from Judea & Samaria to the east bank of the Jordan River:
Nor will the Arab population within Palestine be able to grow indefinitely. Some outmigration, even in the absence of forced expulsion, is inevitable. The tiny Gaza Strip is now one of the most densely settled areas of the world, and there is a limit to its ability to contain more people, even at the appalling levels of subsistence that now prevail. (Abu-Lughod 1986, 12).
According to a 1994 study by Dr. Waal Ennab, from 1952 until May 30, 1967, 88,195 residents left Gaza and 385,294 residents left Judea & Samaria (Ennab 1994). Together with the above estimate, this indicates that 507,794 residents left Judea & Samaria.
According to UN data, the negative migration balance from Judea & Samaria and the Gaza Strip in the years 1950-1966 totaled 363,399 (United Nations 2022). This balance is close to the figure given by Dr. Ennab as the migration balance from 1952 to May 30, 1967, in Judea & Samaria alone. In this period the total migration balance from Judea & Samaria and the Gaza Strip amounted to 624,348 individuals, of whom 405,766 left Judea & Samaria according to the summary of data from the CBS and the Civil Administration for 1967-2007, and another 218,582 left Gaza.
According to the United Nations, the total negative migration balance from Judea & Samaria and the Gaza Strip in the years 1967-2007 was 531,483 (United Nations 2022).
Dr. Mustafa Khawaja stated that the migration balance for the years 1967-2008 from Judea and Samaria was negative—an average of ten thousand migrants per annum. The balance only became positive during the two Gulf Wars (1991, 2003) and with the arrival of PLO loyalists with their families following the Oslo Accords. The negative migration balance in Judea & Samaria amounts to about 410,000 individuals (Khawaja 2010).
The Channel 20 program “This is the Day” mentioned a report by the Arabic daily Al Quds stating that “At least 400,000 young Arabs have moved abroad from Judea & Samaria in recent decades” (Liel 2019), although publications of the USCB for the period 1997-2015 stated that the migration balance from Judea & Samaria and the Gaza Strip was zero.
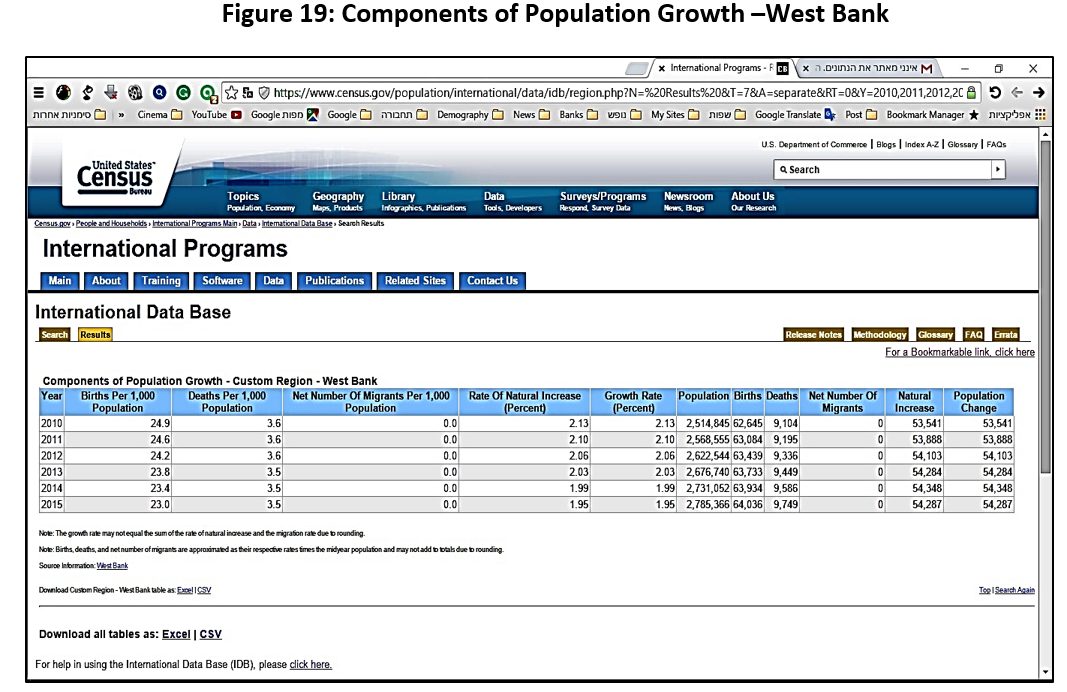
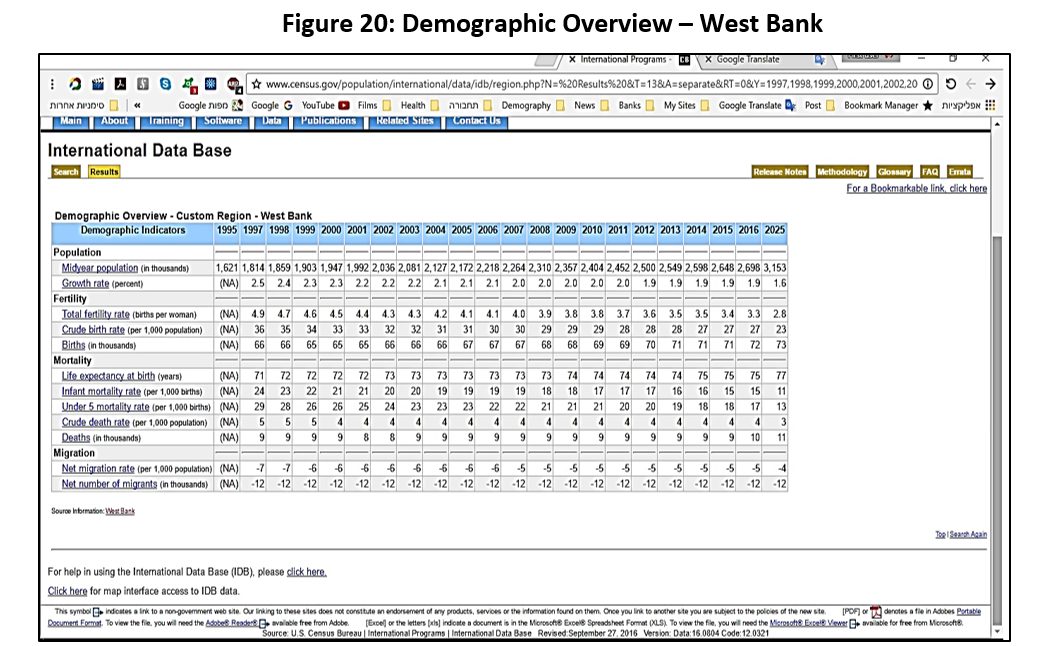
It was only starting in 2016 that the USCB began retroactive publication of data showing a negative migration balance for Judea & Samaria and the Gaza Strip since 1997. But the publication for 2016 showed a negative balance from Judea & Samaria for every year since 1997, and the forecast up to 2025 showed the same number—12,000 migrants (see Figure 20—a screen shot from the USCB website giving the correct figures for 27 September 2016).
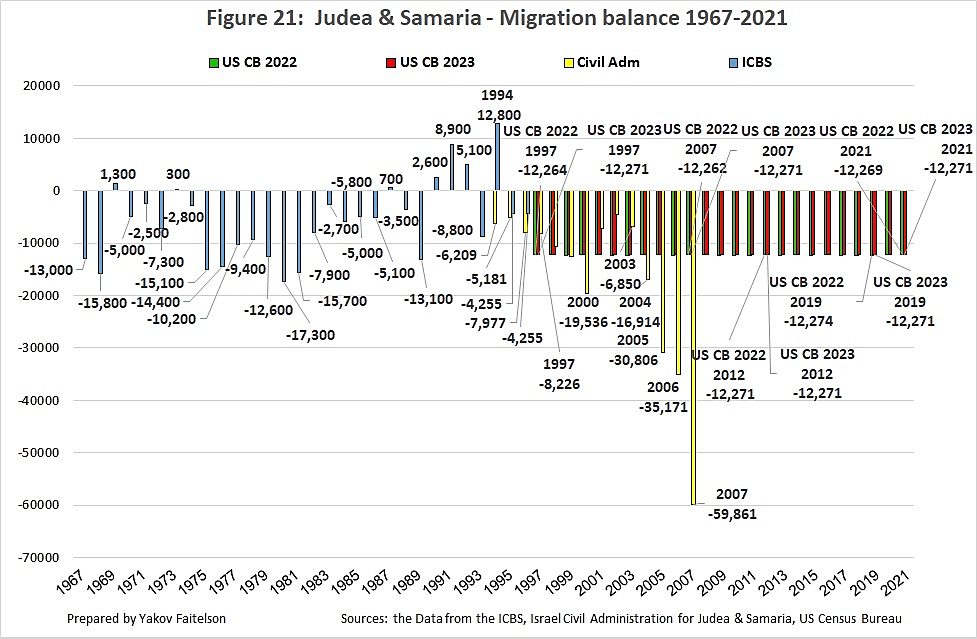
Below are figures for migration from Judea & Samaria (Figure 21) and the Gaza Strip (Figure 22) for the years 1967 to 2021.
The most striking fact is that there are considerable differences regarding the scope of Arab migration from Gaza Strip in the assessments for 1997-2021 published by the USCB in 2022 and 2023.
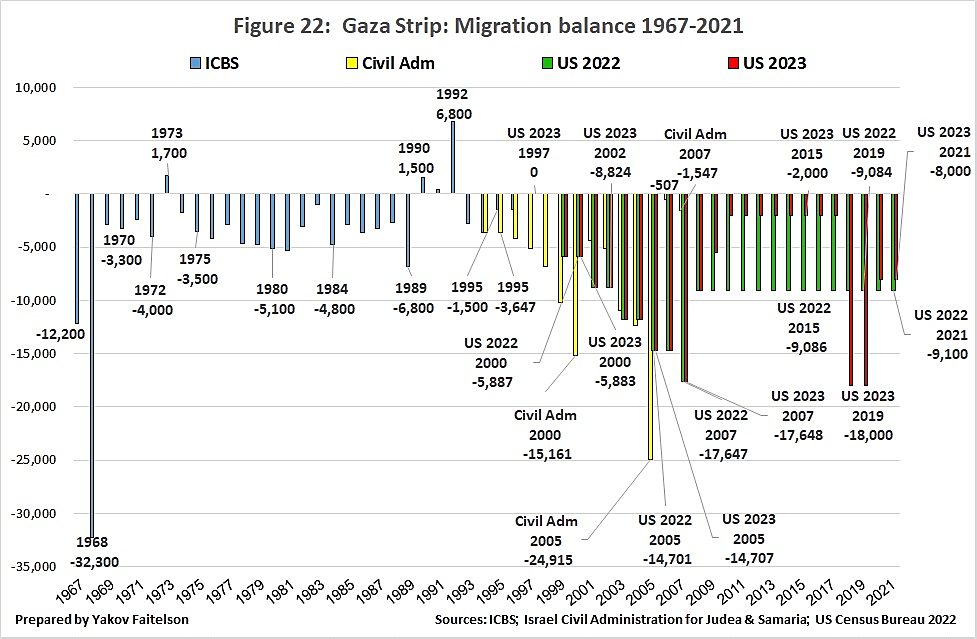
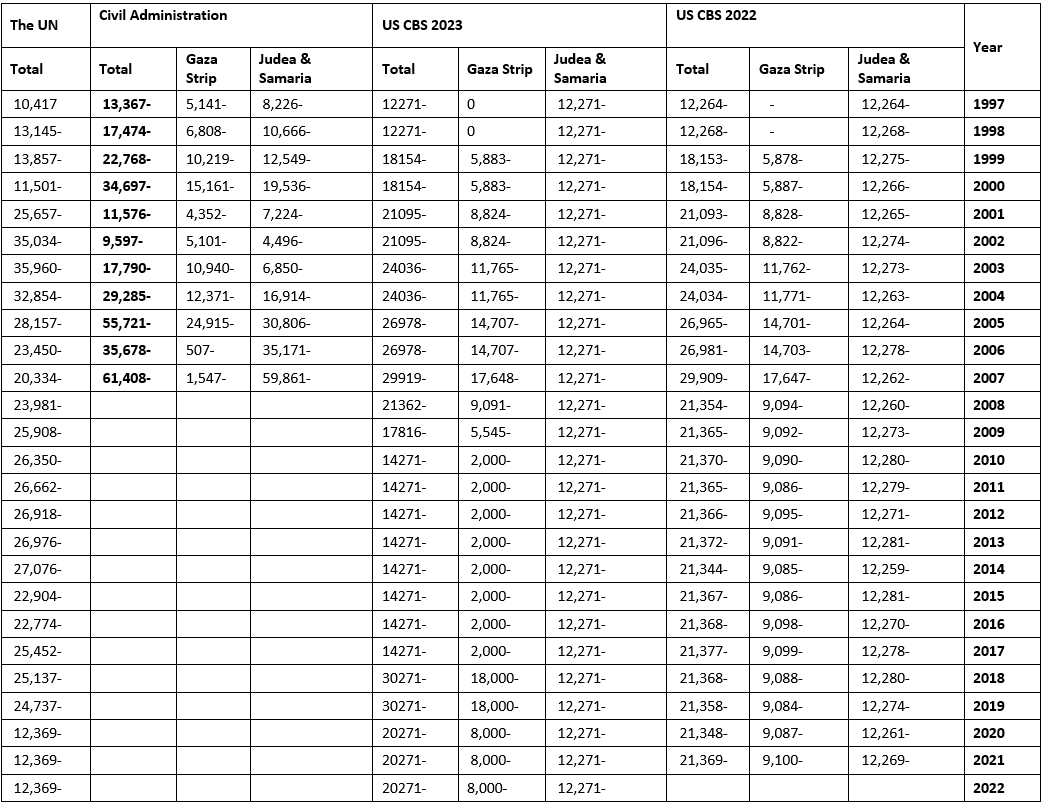
Let us compare these estimates with the data from the Civil Administration and from the UN for the years 1997-2021 (see Table 1 below). According to the Civil Administration, the migration balance in the period 1997-2007 amounted to 309,361 individuals, of which 212,299 were from Judea & Samaria and 97,062 from Gaza.
According to the USCB assessments from 2023, the total migration balance in this period was 24.0% lower at 234,987 individuals. Out of this, the number of migrants from Judea & Samaria was 36.4% lower at 134,981, while the migration balance from the Gaza Strip was 100,006 individuals, 3.0% higher than the Civil Administration data (US Census Bureau 2024).
According to UN data for those years, 229,532 residents left the Palestinian Authority areas (United Nations 2022).
What is particularly striking is that the Civil Administration data clearly reflect the impact of political and security developments in Judea & Samaria and the Gaza Strip following the clashes between Hamas and the PLO leadership in 2005-2007.
The negative migration balance in Judea & Samaria reached a peak of 59,861 in 2007—93.7% higher than in 2005, and 69.7% higher than in 2006. But strangely enough, according to the USCB, in the years 1997-2022 the number of migrants leaving Judea & Samaria was more or less the same each year, at around 12,271 per annum. The USCB data on the Gaza Strip recur every two years.
According to the Civil Administration, the negative migration balance in Gaza in 2005 was 24,915 individuals, in 2006 it was only 507, and in 2007 it was 1,547. But according to the 2022 USCB estimate, in 2005-2006 the figure was 14,701 residents per annum, in 2007, 17,647 and in the years 2008-2021, an average of 9,091 each year. Yet according to the assessment from 2023, the balance was 5,545 in 2009; in the years 2010-2017 it was fixed at around 2,000 per annum; in the years 2018-2019 it was 18,000, and 8,000 individuals in each of the years 2020-2022.
A summary of the CBS 1997 negative migration data from Judea & Samaria and the Gaza Strip for the period 1967-1993, the data from the Civil Administration for the years 1994-2007, and the USCB data for the years 2008-2021 gives 878,878 individuals, of whom 577,660 were from Judea & Samaria and 301,218 from Gaza.
According to UN data, the negative migration balance from Judea & Samaria and the Gaza Strip from 1967 to 2021 was 861,096 (United Nations 2022), but in 2020 and 2021 it was 12,369 per annum, matching the data of the USCB for Judea & Samaria only.
If we add to the UN data the assessment of the USCB for 2020-2021 for Gaza we will see that the total migration balance according to the UN for the period 1967-2021 totaled 877,096—only 0.2% lower than the total of the figures from the CBS, the Civil Administration and the USCB as presented above.
Table 1: Migration Balance from Judea & Samaria and the Gaza Strip
How many Jews and Arabs will be living in the Land of Israel in 2065?
In a discussion at the Foreign Affairs & Defense Committee of the Knesset in May 2018 the CBS presented its demographic forecast for Israel until 2065, that stated:
No significant changes are expected in the proportion of Jews & others and Arabs in the total population […] In another 50 years (in 2065) the share of Jews & others is expected to rise to 81%, the share of the Arabs is expected to fall to 19% […] The share of Arab children who constituted 25% of the 0-14 age group in 2015 will fall to 15% in another 50 years (CBS 2017, 1).
In June 2021 a conference was held on “Demography and National Security: Rethinking,” initiated by the Institute for National Security Studies and the Azrieli Center for Israel Studies at the Ben-Gurion Institute for Israel Research. At this conference Prof. Sergio Della-Pergola presented a diagram showing the demographic forecast for 2065, whereby the population of the Land of Israel would number 30 million people. Three scenarios were presented: the population of the State of Israel only, the population of Israel plus Judea & Samaria, and all these together with the population of the Gaza Strip.
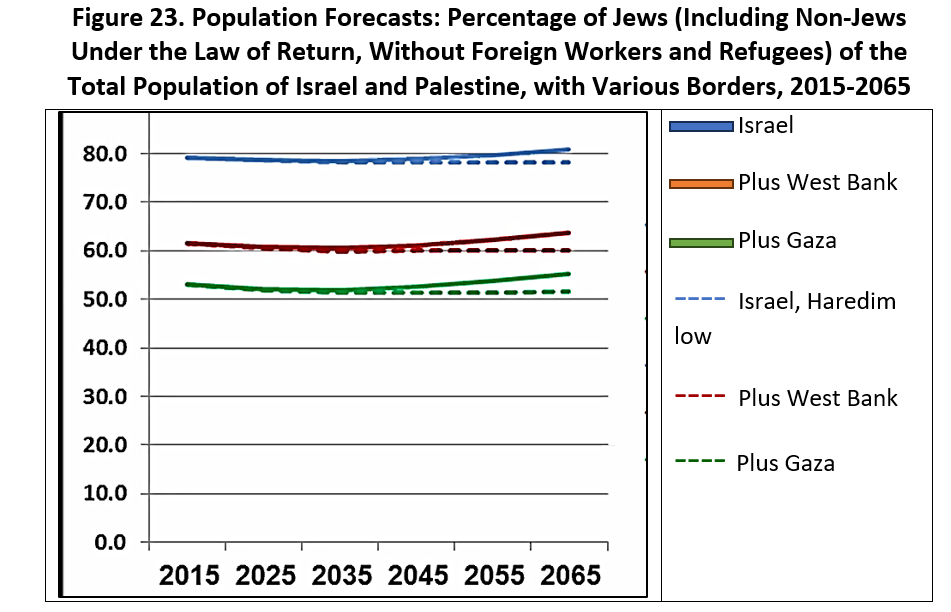
According to Prof. Della-Pergola:
In the territory of the State of Israel […] the Jewish population including non-Halakhic Jews is around 80%, both today and probably for the coming decades […] If we repeat the same calculation for the unit of Israel plus Judea & Samaria in round figures the percentage of Jews is about 60%, and this too is fairly stable […] and will remain so in the future […] The third scenario including Gaza […] gives us around 50-60% (INSS Israel 2021).
Based on these estimates, by 2065 the Hebrew population will number 15 million, Israeli Arabs will number about 3,750,000 constituting 12.5% of the total population of the Land of Israel, there will be 6,250,000 Arabs in Judea & Samaria, representing 20%, and 5 million Arabs in Gaza—16.7%.
The implication is that contrary to Prof. Della-Pergola’s previous estimates, the share of the Jewish population is likely to drop to half of the total population in the western Land of Israel only in the fourth decade of the twenty-first century. As shown by his diagram (Figure 23 above), the proportion of Jews will even approach 55% (at least) of this total in 2065.
But reality is complex, and it is wrong to rely on purely mathematical calculations when preparing long term demographic forecasts. In my estimation, in addition to the continuing fall in the Arab birthrate and the rise in mortality, the trend of overseas migration among Israeli Arabs will rise, similar to the existing trend among the residents of Judea & Samaria and the Gaza Strip. One of the factors that could influence this process is the range of options created by the Abraham Accords and changes in the migration policies of the Gulf Emirates and the Saudi kingdom.
The Saudi Crown Prince Mohammed bin Salman has called on Israeli Arabs to come to live and work in Saudi Arabia. Dr. Shay Attias quotes a senior journalist in the Kingdom: “The best way to improve relations between Israel and Saudi Arabia is to enable Israeli Arabs to work in the Gulf, and thus build bridges between the countries” (Attias 2019).
In an article “How the Jewish majority in Israel will increase,” I gave a forecast for the year 2065 whereby the Israeli population could reach 18,234,206, composed of 15,369,916 Hebrews and 2,864,206 Arabs (Faitelson 2020). Assuming that the negative migration balance remains at the average level of the past twenty years, that the drop in total fertility increases, and that population aging leads to greater mortality rates—the Arab population in Judea & Samaria and the Gaza Strip would be around 2.6 million.
Thus, the total population of the Land of Israel could be about 20,834,000 in 2065, and not 30 million as predicted by Prof. Della-Pergola. In this case, Jews would account for 73.8% of the total population of the Land of Israel, while the Arabs of Israel would account for 13.7%, and the Arabs of Judea & Samaria and the Gaza Strip would be 12.5%.
Summary
Two main factors characterize demographic development in the Land of Israel—natural movement and the migration balance of both Jews and Arabs.
From the early days of Zionist settlement, the Arab birthrate in the Land of Israel was higher than the Jewish birthrate. In 2016 there was a reversal and the total fertility of the Jews exceeded that of the Arabs. The downward trend in fertility of the Arab population, which is adopting patterns of demographic behavior typical of modern educated groups, is happening simultaneously with the aging of the Arab “baby boomer” generation of the 1950s and 1960s in Israel and the 1970s in Judea & Samaria and the Gaza Strip.
Analysis of developments among the various population groups indicates an increase in the proportion of Jews and a decrease in the proportion of Arabs among the total population of the State of Israel since the 1930s. Based on the intermediate option of the CBS forecast for 2065, the rate of live births among the Arabs will fall from 22.8% in 2016 to 13.9% of all births in the State of Israel in 2065 (CBS 2018).
The proportion of Arabs among the total population of Israel is expected to fall from 21.1% in 2022 to 18.4% according to the higher estimation, or 19.3% according to the intermediate option (CBS 2018). The proportion of Arabs in the 0-4 age group is expected to decline accordingly, from 23.7% to 14.4% (CBS 2019).
According to Dr. Youssef Courbage of the Institut national des études démographiques INED:
The recent demographic history of Israel and Palestine is characterized by an inversion of demographic trends. For Palestinians, demographic transition and fertility decrease have accelerated, against all odds… For Israeli Jews, on the contrary, fertility is now increasing, for the total population and mainly in the areas of frictions, the West Bank and Jerusalem...it is difficult to imagine how the Palestinians might be able to reverse their present declining population trends. Maybe not the least of the paradoxes is that they have renounced demography as a way to safeguard their land at a moment where their “population explosion” is still making the headlines of the news. (Courbage 2014, 474-475).
Three factors reinforce the success of the Zionist project:
- Total Jewish fertility is currently higher than that of Arabs in the State of Israel, and of Muslims in particular. The total fertility of the residents of Jewish settlements in Judea & Samaria and in Jerusalem is higher than the total fertility of the Arabs of Judea & Samaria and the Gaza Strip.
- Waves of Jewish immigration recur against a background of outbursts of antisemitism all over the world, particularly in countries where there are large, well established Jewish communities.
- The accomplishments of the State of Israel and the amazing advances of its economic, technological and security achievements attract young Jews.
Sources
Abu-Lughod, Janet. 1986. “The Demographic War for Palestine: The Bottom Line.” The Link, 19(5). https://ameu.org/1986/12/21/the-demographic-war-for-palestine/
AFP. 2017. “Lebanon Conducts First-Ever Census of Palestinian Refugees.” The Jordan Times, December 21, 2017. https://tinyurl.com/yc5tjzwu
Attias, Shay. 2019. “Israeli Arabs Welcomed in Saudi Arabia: Diplomatic Breakthrough or Cynical Ploy? Perspectives Paper No. 1,311.” BESA Center, October 13, 2019. https://tinyurl.com/55yndvnx
Beinin, Joel and Lisa Hajjar. 2014. Palestine, Israel & the Arab-Israeli Conflict. A Primer. Ardmore, PA: Middle East Research & Information Project (MERIP). https://tinyurl.com/mtvmh2mz
Berger, Yotam and Jack Khoury. 2018. “How Many Palestinians Live in Gaza and the West Bank? It's complicated.” Haaretz, March 28, 2018. https://tinyurl.com/2p94y78p
Bernowsky, Yael. 2009. “Lieberman Gets Closer to the Muslims – Who Immigrated from Russia.” Ynet, January 21, 2009. https://tinyurl.com/488b5mc2
Bistrov, Evgenia and Arnon Soffer. 2007. Israel 2007-2020: On Demography and Density, 69. Haifa: Haikin Chair of Geostrategy, Haifa University.
CBS. 1970. Israel Statistical Yearbook 1970—No. 21, 80. Jerusalem: CBS.
-. 1987. Israel Statistical Yearbook 1987—No. 38, 701. Jerusalem: CBS. https://tinyurl.com/yc882vjz
-. 1997. Israel Statistical Yearbook 1997—No. 48. Jerusalem: CBS. https://tinyurl.com/57bf3rdr
-. 1998. Israel Statistical Yearbook 1998—No. 49, Table 2.14. Jerusalem: CBS. https://tinyurl.com/3v5t8jzd
-. 1999. Israel Statistical Yearbook 1999 – No. 50. Jerusalem: CBS. https://tinyurl.com/4pap86fh
-. 2016. “Selected Data on Immigrants from the (former) Soviet Union to mark 25 years since the wave of immigration.” CBS Press Release, April 5, 2016. https://tinyurl.com/y55rda92
-. 2017. “Population Forecast for Israel up to 2065.” CBS Press Release, May 21, 2017. https://tinyurl.com/4w2zbtbz
-. 2018. Population Forecast for Israel 2015-2065. Jerusalem: CBS. https://tinyurl.com/5ejfcfa7
-. 2019. Summary Table: The Population in the Baseline Year of 2015 and Forecasts for the Years 2025, 2035, 2045, 2055 and 2065, by Population Group and Alternatives. Jerusalem: CBS. https://tinyurl.com/mszkun44
-. 2022. Israel Statistical Yearbook 2022—No. 73. Jerusalem: CBS. https://tinyurl.com/5hy63px4
-. 2023a. Israel Statistical Yearbook 2023—No. 74. Table 2.53 Immigrants, by Period of Immigration and Last Continent of Residence. Jerusalem: CBS. https://tinyurl.com/yd9ur8mb
-. 2023b. Fertility of Jewish and Other Women in Israel, by Their Degree of Religiosity, 1979-2022. September 12, 2023. Jerusalem: CBS. https://tinyurl.com/3cne3cwc
-. 2023c. Israel Statistical Monthly—December 2023, Table 2c. Jerusalem: CBS. December 11, 2023. https://tinyurl.com/3ab43s6k
-. 2023d. “The Population of Israel at the Start of 2024.” CBS Press Release, December 28, 2023. https://tinyurl.com/msfn693c
-. 2023e. Israel Statistical Yearbook 2023—No. 74. Table 2.9 Jews, by Continent of Origin, Continent of Birth and Period of Immigration.
-. 2023f. - Israel Statistical Yearbook 2023 - No.75. Table 3.5 Life Expectancy, by Sex, Religion and Population Group. Jerusalem: CBS. https://www.cbs.gov.il/en/publications/Pages/2023/Health-Statistical-Abstract-of-Israel-2023-No-74.aspx
-. 2024a. Israel Statistical Monthly—January 2024, Table 1/b. Jerusalem: CBS. January 18, 2024. https://tinyurl.com/nbascry3
-. 2024b. Israel Statistical Monthly—March 2024, Table 2/b. Jerusalem: CBS. March 14, 2024, https://tinyurl.com/5n6tp5s
Courbage, Youssef. 2014. “Demography and Conflicts in the Context of Israel/Palestine: Forecasts for the Future.” International Relations and Diplomacy, 2(7): 462-476. https://tinyurl.com/mvfa6fbn
Database. Earth. 2024. Total Fertility Rate of Egypt. n.d. Historic Total Fertility Rate of Egypt (1950-2024) and Future Projections. https://tinyurl.com/42c9m492
Ennab, Waal R. 1994. Population and Demographic Developments in the West Bank and Gaza Strip Until 1990, 61. United Nations Conference on Trade and Development. UNCTAD/ECDC/SEU/1. https://tinyurl.com/4jcwnvu3
Ettinger, Yoram. 2008. “The Palestinian Census: They’re fooling us.” Ynet, February 10, 2008. https://tinyurl.com/5bvd2rud
Faitelson, Yakov. 2003. “Demography – Threat or Problem? A Number of Questions on the Subject of the Demographic Problem in the Land of Israel.” Academia.edu., December 18, 2003. https://www.academia.edu/3330373/Demography_threat_or_problem
Faitelson, Yakov. 2018a. The development of total fertility in the Land of Israel: how did the demographic demon become the demographic miracle? Total fertility among the Arab population in the Land of Israel. (In Hebrew). The Institute for Zionist Strategies. Jerusalem: February 2018. Demography_1503.pdf (izs.org.il)
Faitelson, Yakov. 2018b The Big Lie of Demographic Data. (In Hebrew). Israel today. 27/3/2018 israelhayom.co.il/news/geopolitics/article/10675043
-. 2008. Demographic Trends in the Land of Israel (1800-2007). Position paper, 23-24. Jerusalem: Institute for Zionist Strategies.
-. 2018a. Development of Total Fertility in the Land of Israel: How Did The Demographic Demon Become The Demographic Miracle? Jerusalem: Institute for Zionist Strategies. https://tinyurl.com/4vuf7b68
-. 2018b. “The Big Lie of the Demographic Data.” Israel Today, March 26, 2018. https://tinyurl.com/ednsu2ek
-. 2020. “How Israel's Jewish Majority Will Grow.” Middle East Quarterly, 27(4). https://tinyurl.com/yc8zrepk
Fargues, Philippe. 2000. “Protracted National Conflict and Fertility Change: Palestinians and Israelis in the Twentieth Century.” Population and Development Review, 26(3): 441-482. https://tinyurl.com/48eha7w4
Focus Anthro 2007. The Fertility Dynamic of Israel’s Ultra-Orthodox Jews and Pronatalist Governmental Policy. Welfare Policy, p. 40.
Greenberg, Joel. 1997. “Palestinian Census Ignites Controversy Over Jerusalem.” New York Times, December 11, 1997. https://tinyurl.com/r7wyptzc
Halul, Shadi. 2015. “A New Nation is Born: The Members of the Aramaic Community.” Israel Today, August 23, 2015. https://tinyurl.com/bddkwmjb
Hleihel, Ahmad 2011. Fertility of Jewish and Muslim Women in Israel by Their Level of Religiosity in the Years 1979-2009. Working Papers Series no. 60. Jerusalem: Central Bureau of Statistics–Demography & Census Division. https://www.cbs.gov.il/en/publications/Pages/pw/Fertility-among-Jewish-and-Muslim-Women-in-Israel-by-Level-of-Religiosity-1979-2009.aspx
Honig, Marjorie. 1974. The Effect of Child Allowances on Fertility. Jerusalem: The National Insurance Institute. https://tinyurl.com/ybpr6b4h
INSS Israel. 2021. “Demography and National Security – Rethinking (video).” YouTube, June 20, 2021., minute 30.33. https://tinyurl.com/bdcymmaf
Kashti, Or. 2021. “The Average Birthrate Among Bedouin Women has Fallen by Half Within 20 years.” Ha’aretz, 2 December 2, 2021. https://tinyurl.com/mrkcsenr
Kasnett, Israel. 2018. “The Future of Israel's 'Haredi' Population: Is it Growing or Shrinking?” JNS, June 5, 2018. https://tinyurl.com/jumyhyy3
Khawaja, Mustafa. 2010. Highly-Skilled Migration into, Through and From the Southern and Eastern Mediterranean and Sub Saharan Africa. The Case of Palestine. Florence: European University Institute. https://tinyurl.com/4h8bz327
Lan, Shlomit. 2008. 60 to 60: The Large Economic Events in the History of the State. Globes, May 5, 2008. 60 עד 60: האירועים הכלכליים הגדולים בתולדות המדינה - גלובס (globes.co.il)
Liel, Lisa. 2019. “Accelerated Emigration of Arabs From Judea and Samaria Abroad (video).” YouTube, March 24, 2019. https://tinyurl.com/5amn7faw
Marchetti, Cesare, Perrin S. Meyer and Jesse H. Ausubel. 1996. “Human Population Dynamics Revisited with the Logistic Model: How Much can be Modeled and Predicted?” Technological Forecasting and Social Change 52: 1–30. https://tinyurl.com/2h62252a
McCarthy, Justin. 2001. Palestine's Population During the Ottoman and the British Mandate Periods, 1800-1948. Palestine Remembered. https://tinyurl.com/293jar92
MEMRI. 2018. After Census Finds 174,422 Palestinian Refugees in Lebanon, Some Lebanese Fear They Will be Permanently Settled in the Country, Others Call to Grant Them Civil Rights. Special Dispatch No. 7406. March 30, 2018. https://tinyurl.com/4mxht8vp
PCBS—Palestinian Central Bureau of Statistics. 1998. Census–1997. Ramallah: PCBS.
-. 2006. Palestinians at the End of Year 2006. The Palestinian Population in the Palestinian Territory, Table 2, 31. Ramallah: PCBS.
-. 2007. Statistical Abstract of Palestine No 9. Ramallah: PCBS.
Petreanu, Dan. 1988. “Demography: Men or Myth.” The Jerusalem Post, August 16, 1988.
PNA—Palestinian National Authority. 2004. The Palestinian Population in Palestine; Population and Demography; Health Status in Palestine 2003. Ramallah: PNA.
-. 2006a. Demographic and Health Survey – 2004: Final Report. Introduction. 1.2 Socioeconomic Situations: 1.2.1 Population and household, 29. Ramallah: PNA.
-. 2006b. Ministry of Health—Palestine. Annual Report 2005 Demography and Population, Chapter 1. Ramallah: PNA.
Revhun, Uzi and Gilad Malach. 2008. Demographic Trends in Israel: Position Paper. Edited by Ruth Gabizon, 29. Jerusalem: Metzila Center for Zionist, Jewish, Liberal and Humanist Thinking. https://tinyurl.com/3psn9smd
Rotman, Simcha. 2021. “Instead of ‘Temporary Orders’ the Time has Come for a Basic Citizenship Law.” Mida, July 7, 2021. https://tinyurl.com/texrcek5
Segal, Hagai. 2004. “The Demon-graphic Problem.” Basheva, January 22, 2004. https://tinyurl.com/yu8xnupb
Soffer, Arnon. 2006. “Convergence or Extinction.” Ynet, September 14, 2006. https://tinyurl.com/2ra248ue
Stern Shefler, Gil. 2010. “Jews Now a Minority Between the River and the Sea.” The Jerusalem Post, November 26, 2010. https://tinyurl.com/39nbxnnt
Taub Center 2024. “The Demography of Israel 2023: Declines in Fertility, Migration and Mortality.” Press Release, January 22, 2024. https://tinyurl.com/f7d6e5kd
Toledano, Esther, Noam Zussman, Roni Frisch and Daniel Gottleib. 2009. The Influence of Child Allowances on Fertility and Birthrate, 9, 29. Jerusalem: Bank of Israel. https://tinyurl.com/y6suhmy5
UNFPA. 1999. State of World Population 1999—6 Billion: A Time for Choices, 27. https://tinyurl.com/yc2n2wvc
UNRWA. 2010. West Bank & Gaza Strip Population Census of 2007. https://tinyurl.com/45me9avz
US Census Bureau 2015. West Bank. International Data Base (IDB), Fertility Rates for Custom Region - West Bank. Downloaded: 08-12-2015
- 2015. Gaza. International Data Base (IDB), Fertility Rates for Custom Region - Gaza Strip. Downloaded: 08-12-2015
- 2024. International Database (census.gov) Fertility Rates for Custom Region - Gaza Strip. West Bank. Downloaded: 25/06/2024 17:32
United Nations 2022. World Population Prospects 2022. Online Edition. https://tinyurl.com/y8x76am4
Weiler-Pollack, Dana. 2009. “A New Study Finds How Child Allowances Affect Fertility and the Birthrate. Ha’aretz, December 14, 2009. https://tinyurl.com/5xbf6x5x
Weinreb, Alex. 2023. The Demography of Israel 2023: Declines in Fertility, Immigration and Mortality, 10, 15. Jerusalem: Taub Institute for the Study of Social Policy in Israel. https://tinyurl.com/y4yhp22x
World Bank 2021. World Development Indicators. Population growth (annual %) API_SP.POP.GROW_DS2_en_excel_v2_2708633 Downloaded: 21/07/2021.
World Bank 2023. Life Expectancy at Birth, Total (Years)—West Bank and Gaza. https://data.worldbank.org/indicator/sp.dyn.le00.in?name_desc=true.
World Factbook 2024. West Bank. People and Society. Population. Page last updated: January 23, 2024
World Population Review 2024. World Population by Country Fertility rate, total (births per woman). https://data.worldbank.org/indicator/SP.DYN.TFRT.IN?most_recent_value_desc=true&year_high_desc=true
Yaniv, Omer. 2023. About Your Statistics, Jerusalem 2023—The Existing Situation and Changing Trends, 14-15. Jerusalem: Jerusalem Institute of Policy Research. https://tinyurl.com/ytj2chn9
Zimmerman, Bennett, Roberta Seid and Michael L. Wise. 2006. The Million Person Gap: The Arab Population in the West Bank and Gaza. Ramat Gan: The Begin-Sadat Center for Strategic Studies. https://tinyurl.com/2yh5ftte
______________________
[1] In 1880 67% of all Jews in the world lived in the Russian Empire. At the start of the twentieth century, its authorities determined that the word Hebrew (евреи) defined ethnic origin while the word Jewish referred to religious affiliation. This definition was retained by the Soviet Union. In this article, the terms “Hebrews” or “wider Jewish population” includes Halakhic Jews as well as immigrants who are not classified by religion in the Interior Ministry records.
[2] According to data from an internal file of the Civil Administration from 2008—The Annual Migration Balance, departures of residents of Judea & Samaria and the Gaza Strip through all border crossings (relevant for figures from the Civil Administration below).